


Traces
Contents
Traces are a collection of generations and spans that capture a full interaction between a user and an LLM. The traces tab lists them along with the properties autocaptured by PostHog like the person, total cost, total latency, and more.
Sessions vs Traces
- Trace (
$ai_trace_id): Groups related generations and spans together. Required for all LLM analytics events. - Session (
$ai_session_id): Optional property that groups multiple traces together based on your chosen grouping strategy.
See the Sessions documentation for more details on how to use $ai_session_id.
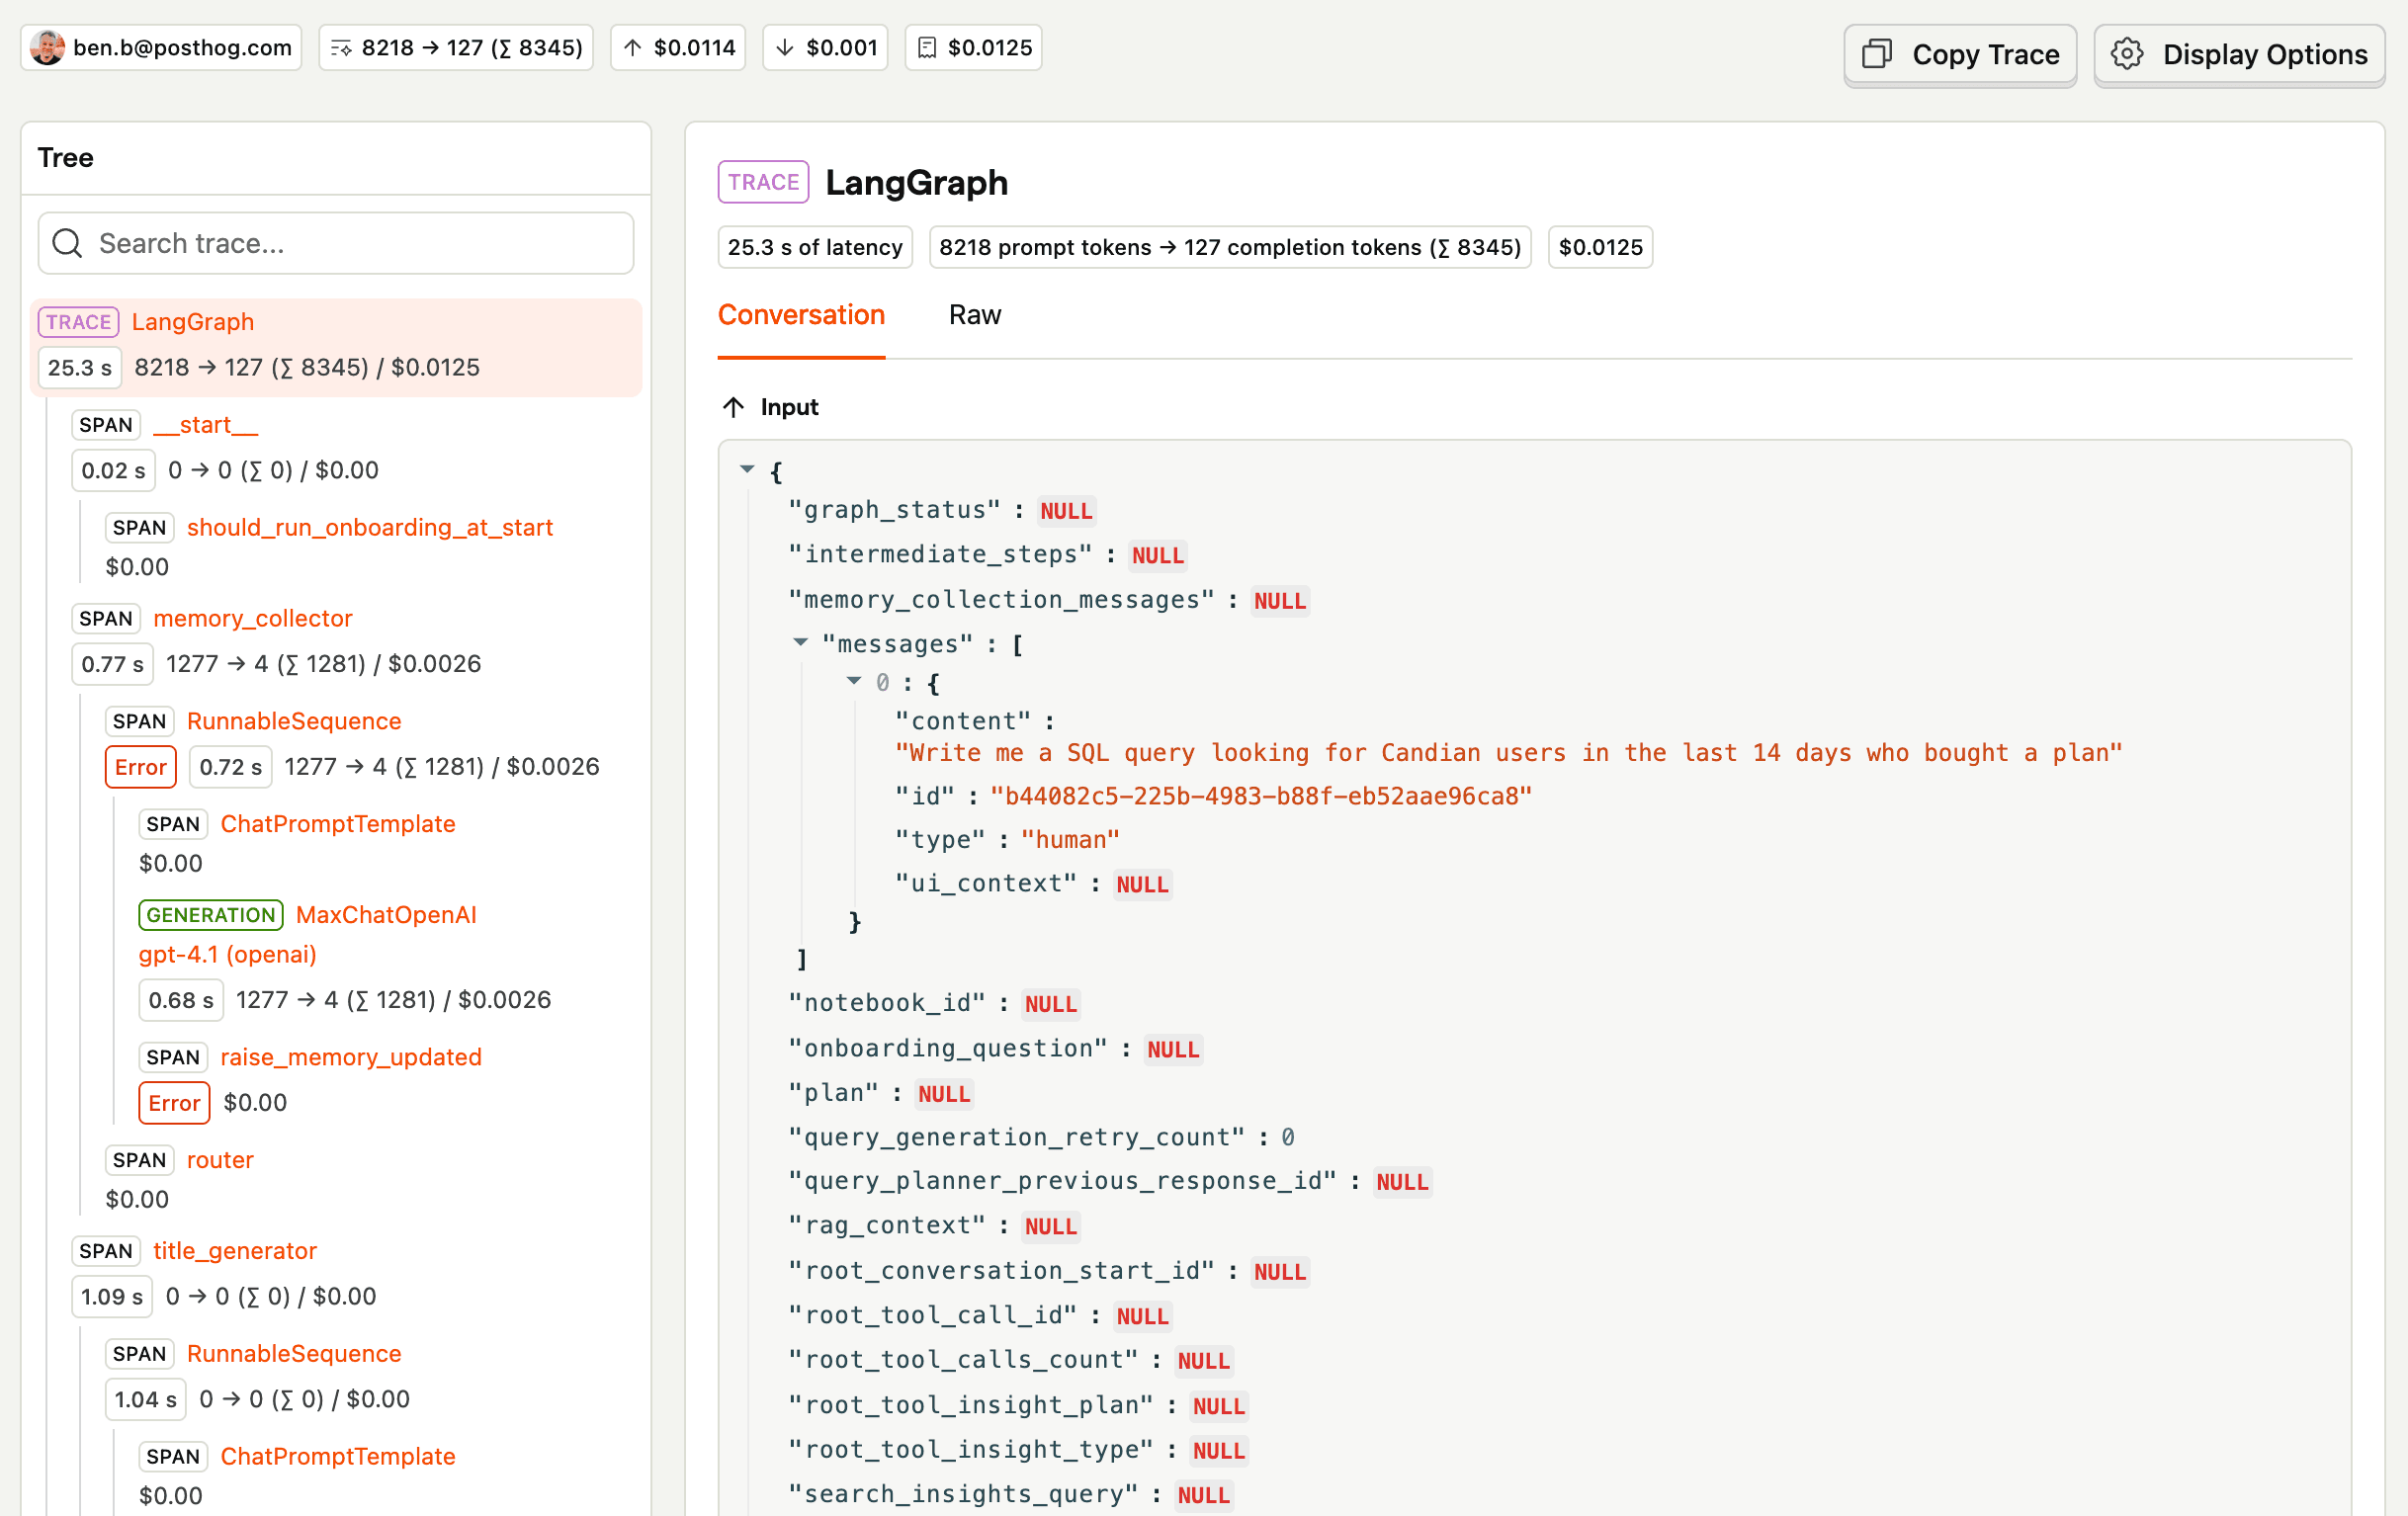
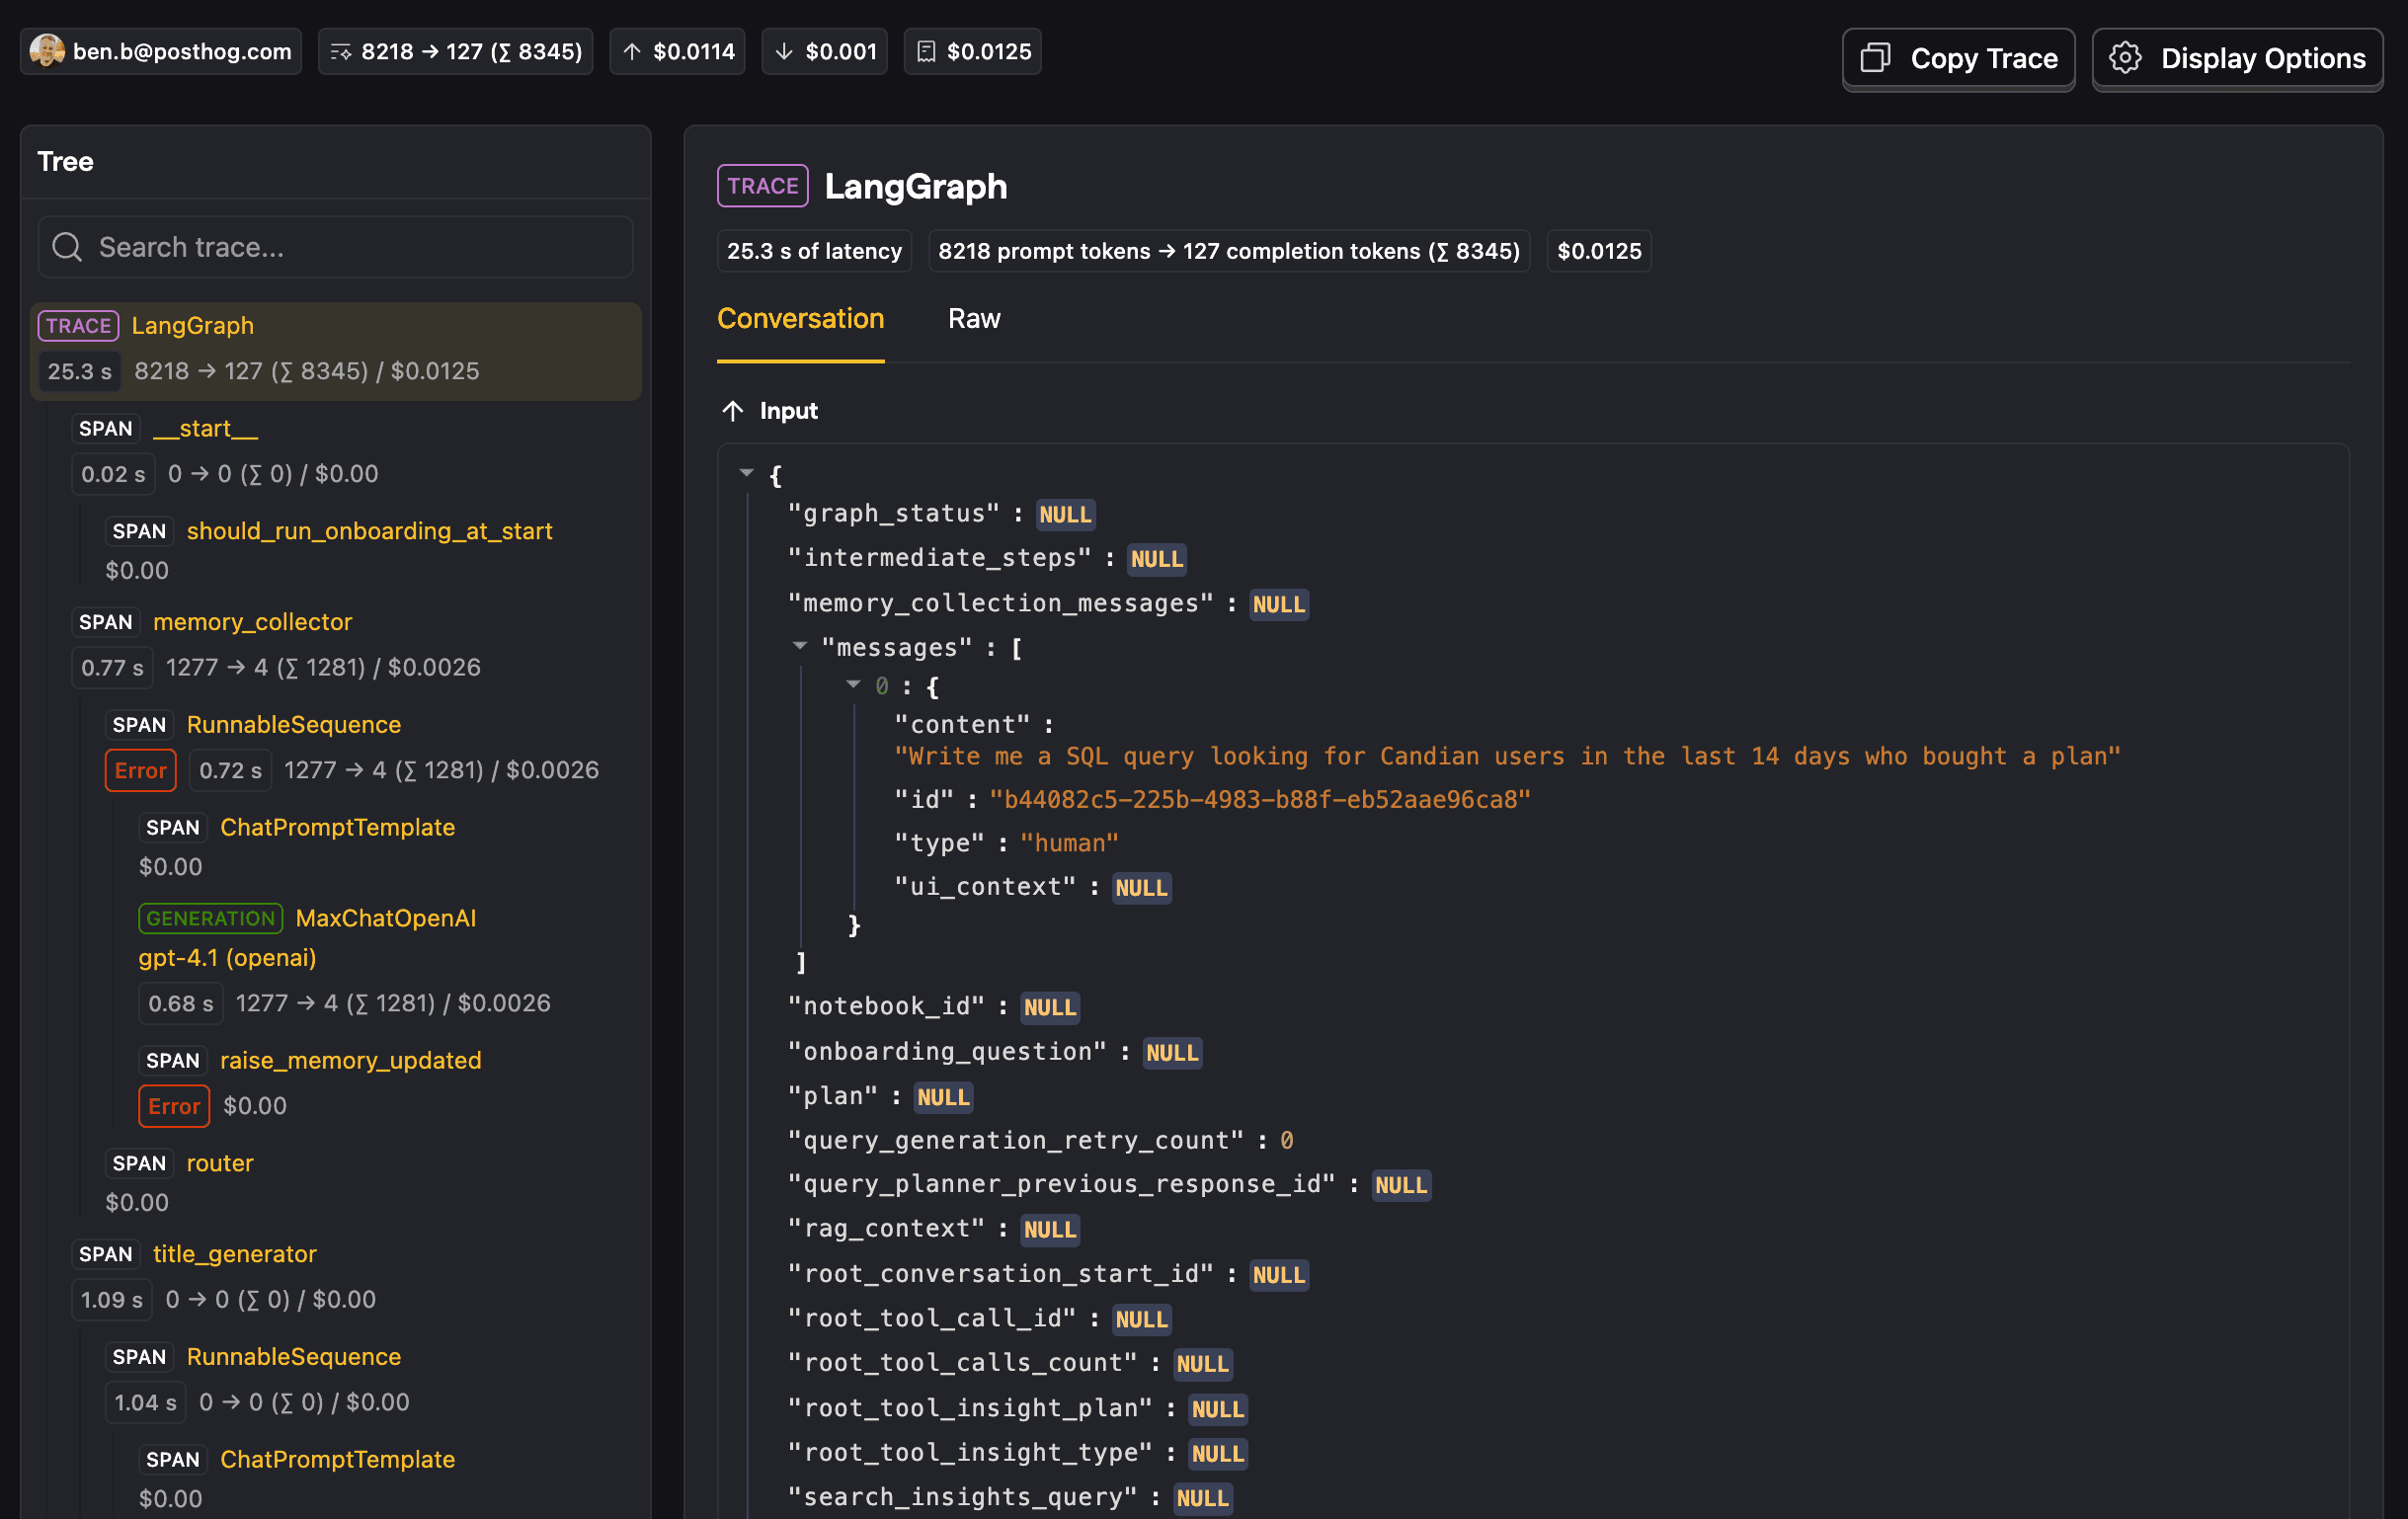
Trace timeline
Clicking on a trace opens a timeline of the interaction with all the generation and span events. The trace timeline enables you to see the entire conversation, profiling details, and the individual generations and spans.
AI event hierarchy
Traces consist of the following event hierarchy:
- (Optional) A session (
$ai_session_id) can group multiple traces together. - A trace (
$ai_trace_id) is the top-level required grouping for LLM events. - A trace can contain multiple spans and generations.
- A span can be the parent of other spans.
- A generation can be the child of a span or trace.
Event properties
A trace is a group that contains multiple spans, generations, and embeddings. Traces can be manually sent as events or appear as pseudo-events automatically created from child events.
Event name: $ai_trace
Core properties
| Property | Description |
|---|---|
$ai_trace_id | The trace ID (a UUID to group related AI events together) |
$ai_session_id | (Optional) Groups related traces together. Use this to organize traces by whatever grouping makes sense for your application (user sessions, workflows, conversations, or other logical boundaries). |
$ai_input_state | The input of the whole trace or any JSON-serializable state |
$ai_output_state | The output of the whole trace or any JSON-serializable state |
$ai_latency | (Optional) The latency of the trace in seconds |
$ai_span_name | (Optional) The name of the trace |
$ai_is_error | (Optional) Boolean to indicate if the trace encountered an error |
$ai_error | (Optional) The error message or object if the trace failed |
Pseudo-trace Events
When you send generation ($ai_generation), span ($ai_span), or embedding ($ai_embedding) events with a $ai_trace_id, PostHog automatically creates a pseudo-trace event that appears in the dashboard as a parent grouping. These pseudo-traces:
- Are not actual events in your data
- Automatically aggregate metrics from child events (latency, tokens, costs)
- Provide a hierarchical view of your AI operations
- Do not require sending an explicit
$ai_traceevent
This means you can either:
- Send explicit
$ai_traceevents to control the trace metadata - Let PostHog automatically create pseudo-traces from your generation/span events