


Spans
Contents
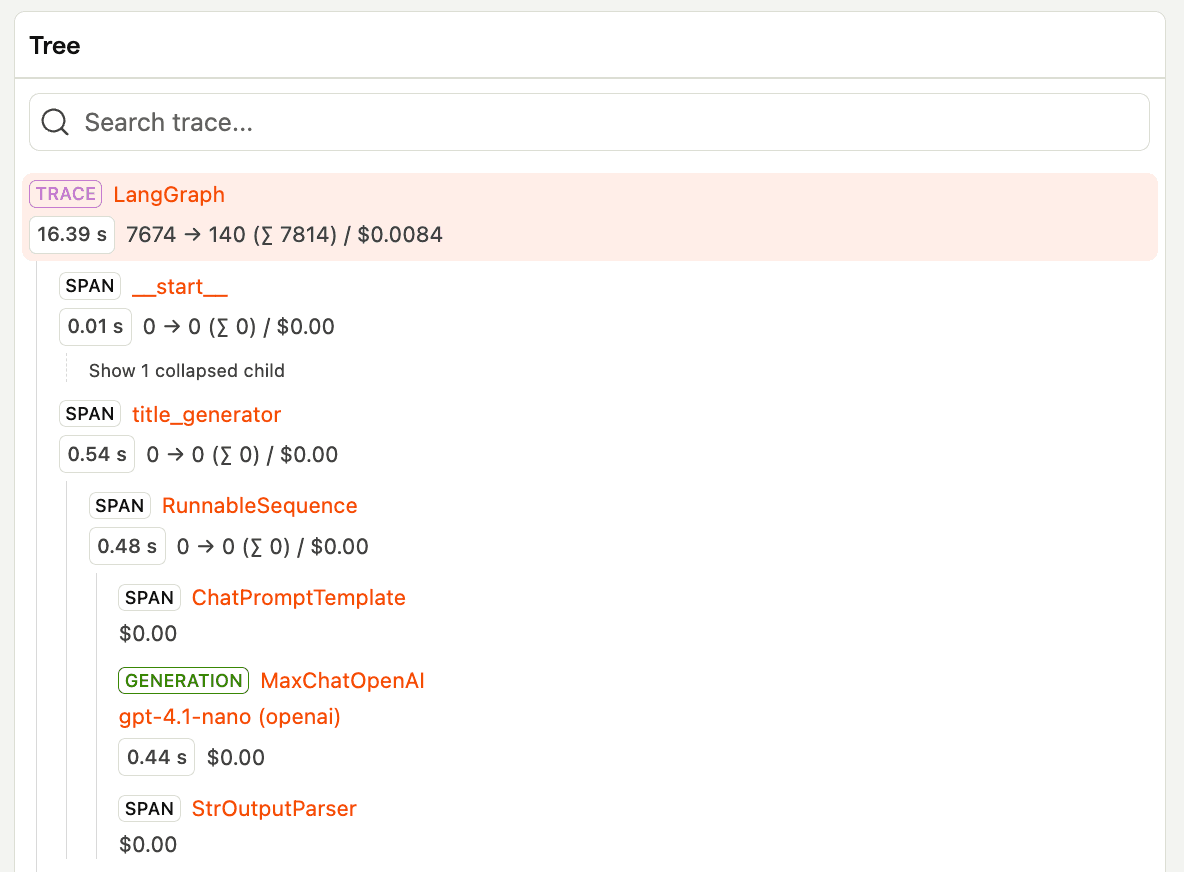
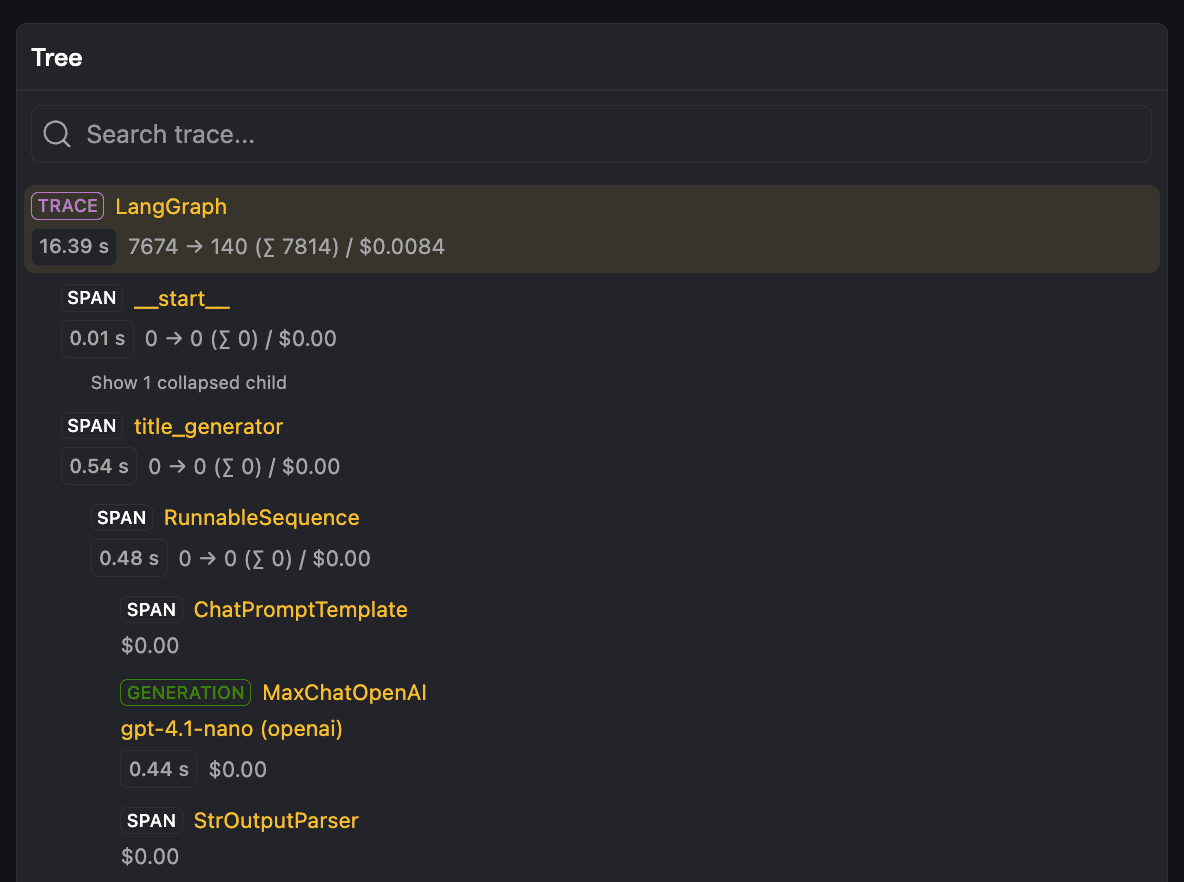
Spans are units of work within an LLM trace. These are events that represent individual operations and discrete durations within your LLM application, like function calls, vector searches, or data retrieval steps, providing granular visibility into the execution flow.
PostHog captures spans to track atomic operations that make up your LLM workflow. For example:
- Generations - LLM calls and interactions
- Vector database searches - Document and embedding retrieval
- Tool/function calls - API calls, calculations, database queries
- RAG pipeline steps - Retrieval, reranking, context building
- Data processing - Validation, chunking, formatting
For technical implementation details, see manual capture.
Event properties
A span is a single action within your application, such as a function call or vector database search.
Event name: $ai_span
Core properties
| Property | Description |
|---|---|
$ai_trace_id | The trace ID (a UUID to group related AI events together) |
$ai_session_id | (Optional) Groups related traces together. Use this to organize traces by whatever grouping makes sense for your application (user sessions, workflows, conversations, or other logical boundaries). |
$ai_span_id | (Optional) Unique identifier for this span |
$ai_span_name | (Optional) The name of the span |
$ai_parent_id | (Optional) Parent ID for tree view grouping ( |
$ai_input_state | The input state of the span or any JSON-serializable state |
$ai_output_state | The output state of the span or any JSON-serializable state |
$ai_latency | (Optional) The latency of the span in seconds |
$ai_is_error | (Optional) Boolean to indicate if the span encountered an error |
$ai_error | (Optional) The error message or object if the span failed |