


Marketing analytics
Contents
This feature is currently an opt-in beta. You can enable it on the feature previews settings page. Please leave a comment on this page if you have feedback or questions, or leave feedback via the in-app support modal.
Marketing analytics enables you to track marketing campaigns, costs, and performance from multiple advertising platforms in your marketing analytics dashboard.
For detailed column definitions, formulas, and platform field mappings, see Column definitions.
Getting started
When you first visit the marketing analytics dashboard, you'll see a guided onboarding wizard that walks you through setup:
- Welcome – Introduction to Marketing Analytics and its capabilities
- Add source – Connect your marketing data sources (native integrations, data warehouse, or self-managed sources)
- Conversion goals – Define what actions count as conversions (optional)
You can skip the conversion goals step and configure them later in settings. Once you complete onboarding, you'll see the full marketing dashboard with your campaign data.
Marketing dashboard
The marketing dashboard contains multiple pre-built insights that help you understand your campaigns and costs.
Marketing costs over time
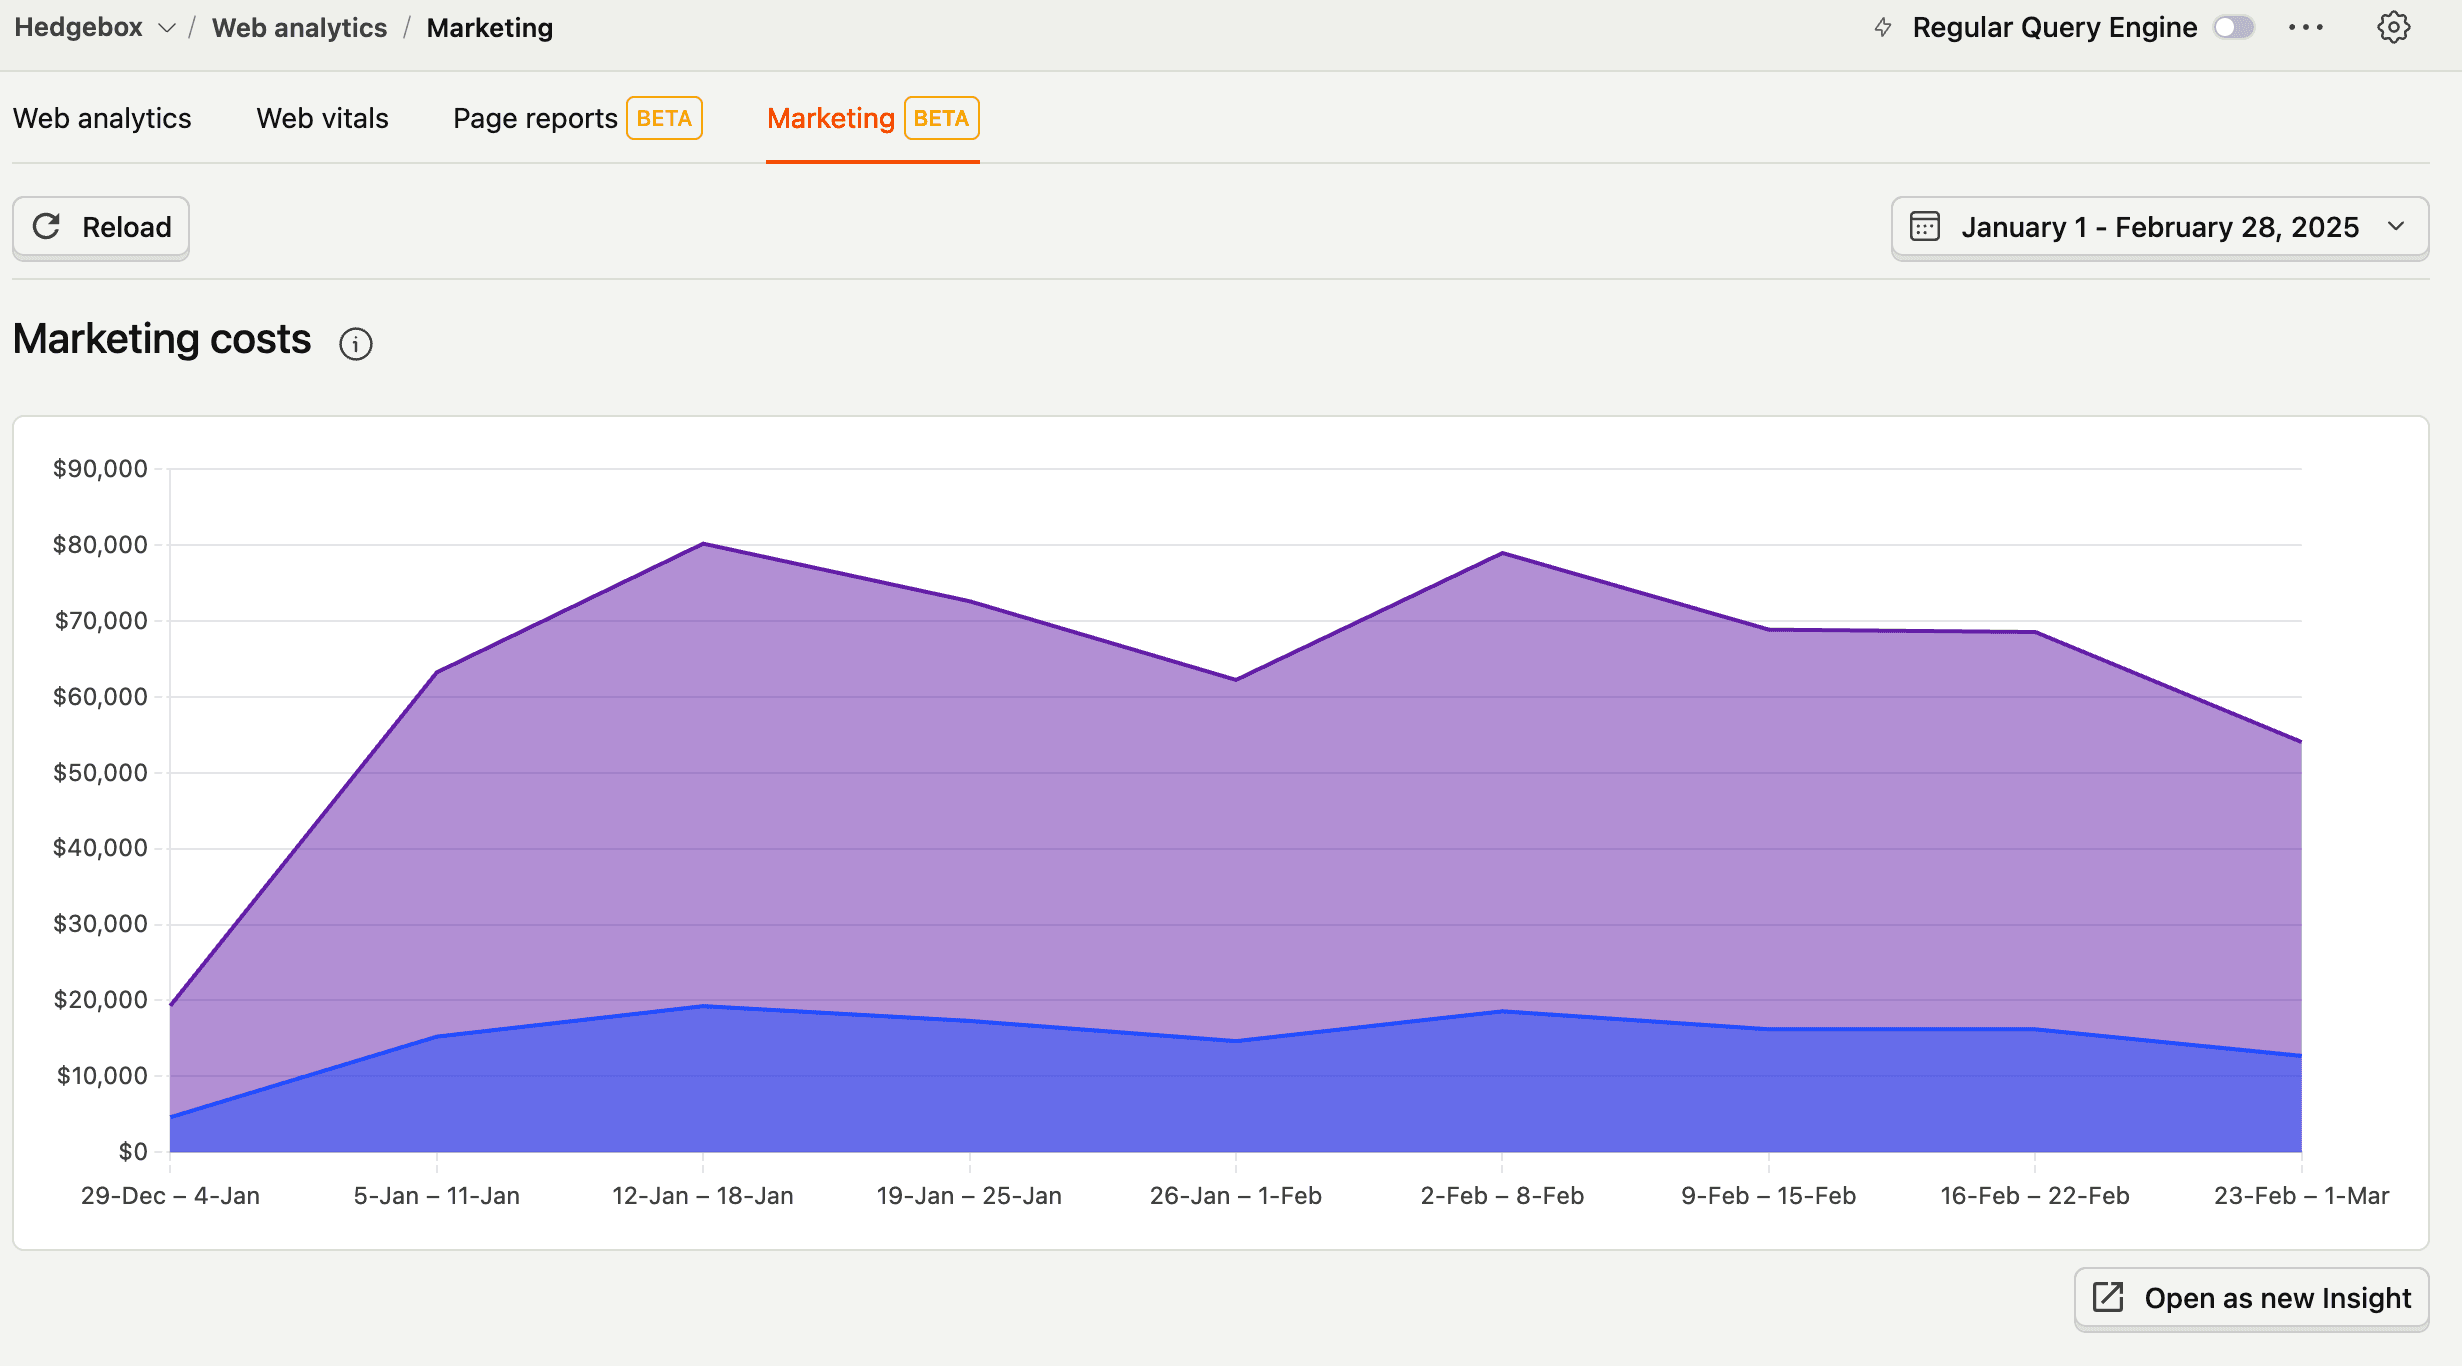
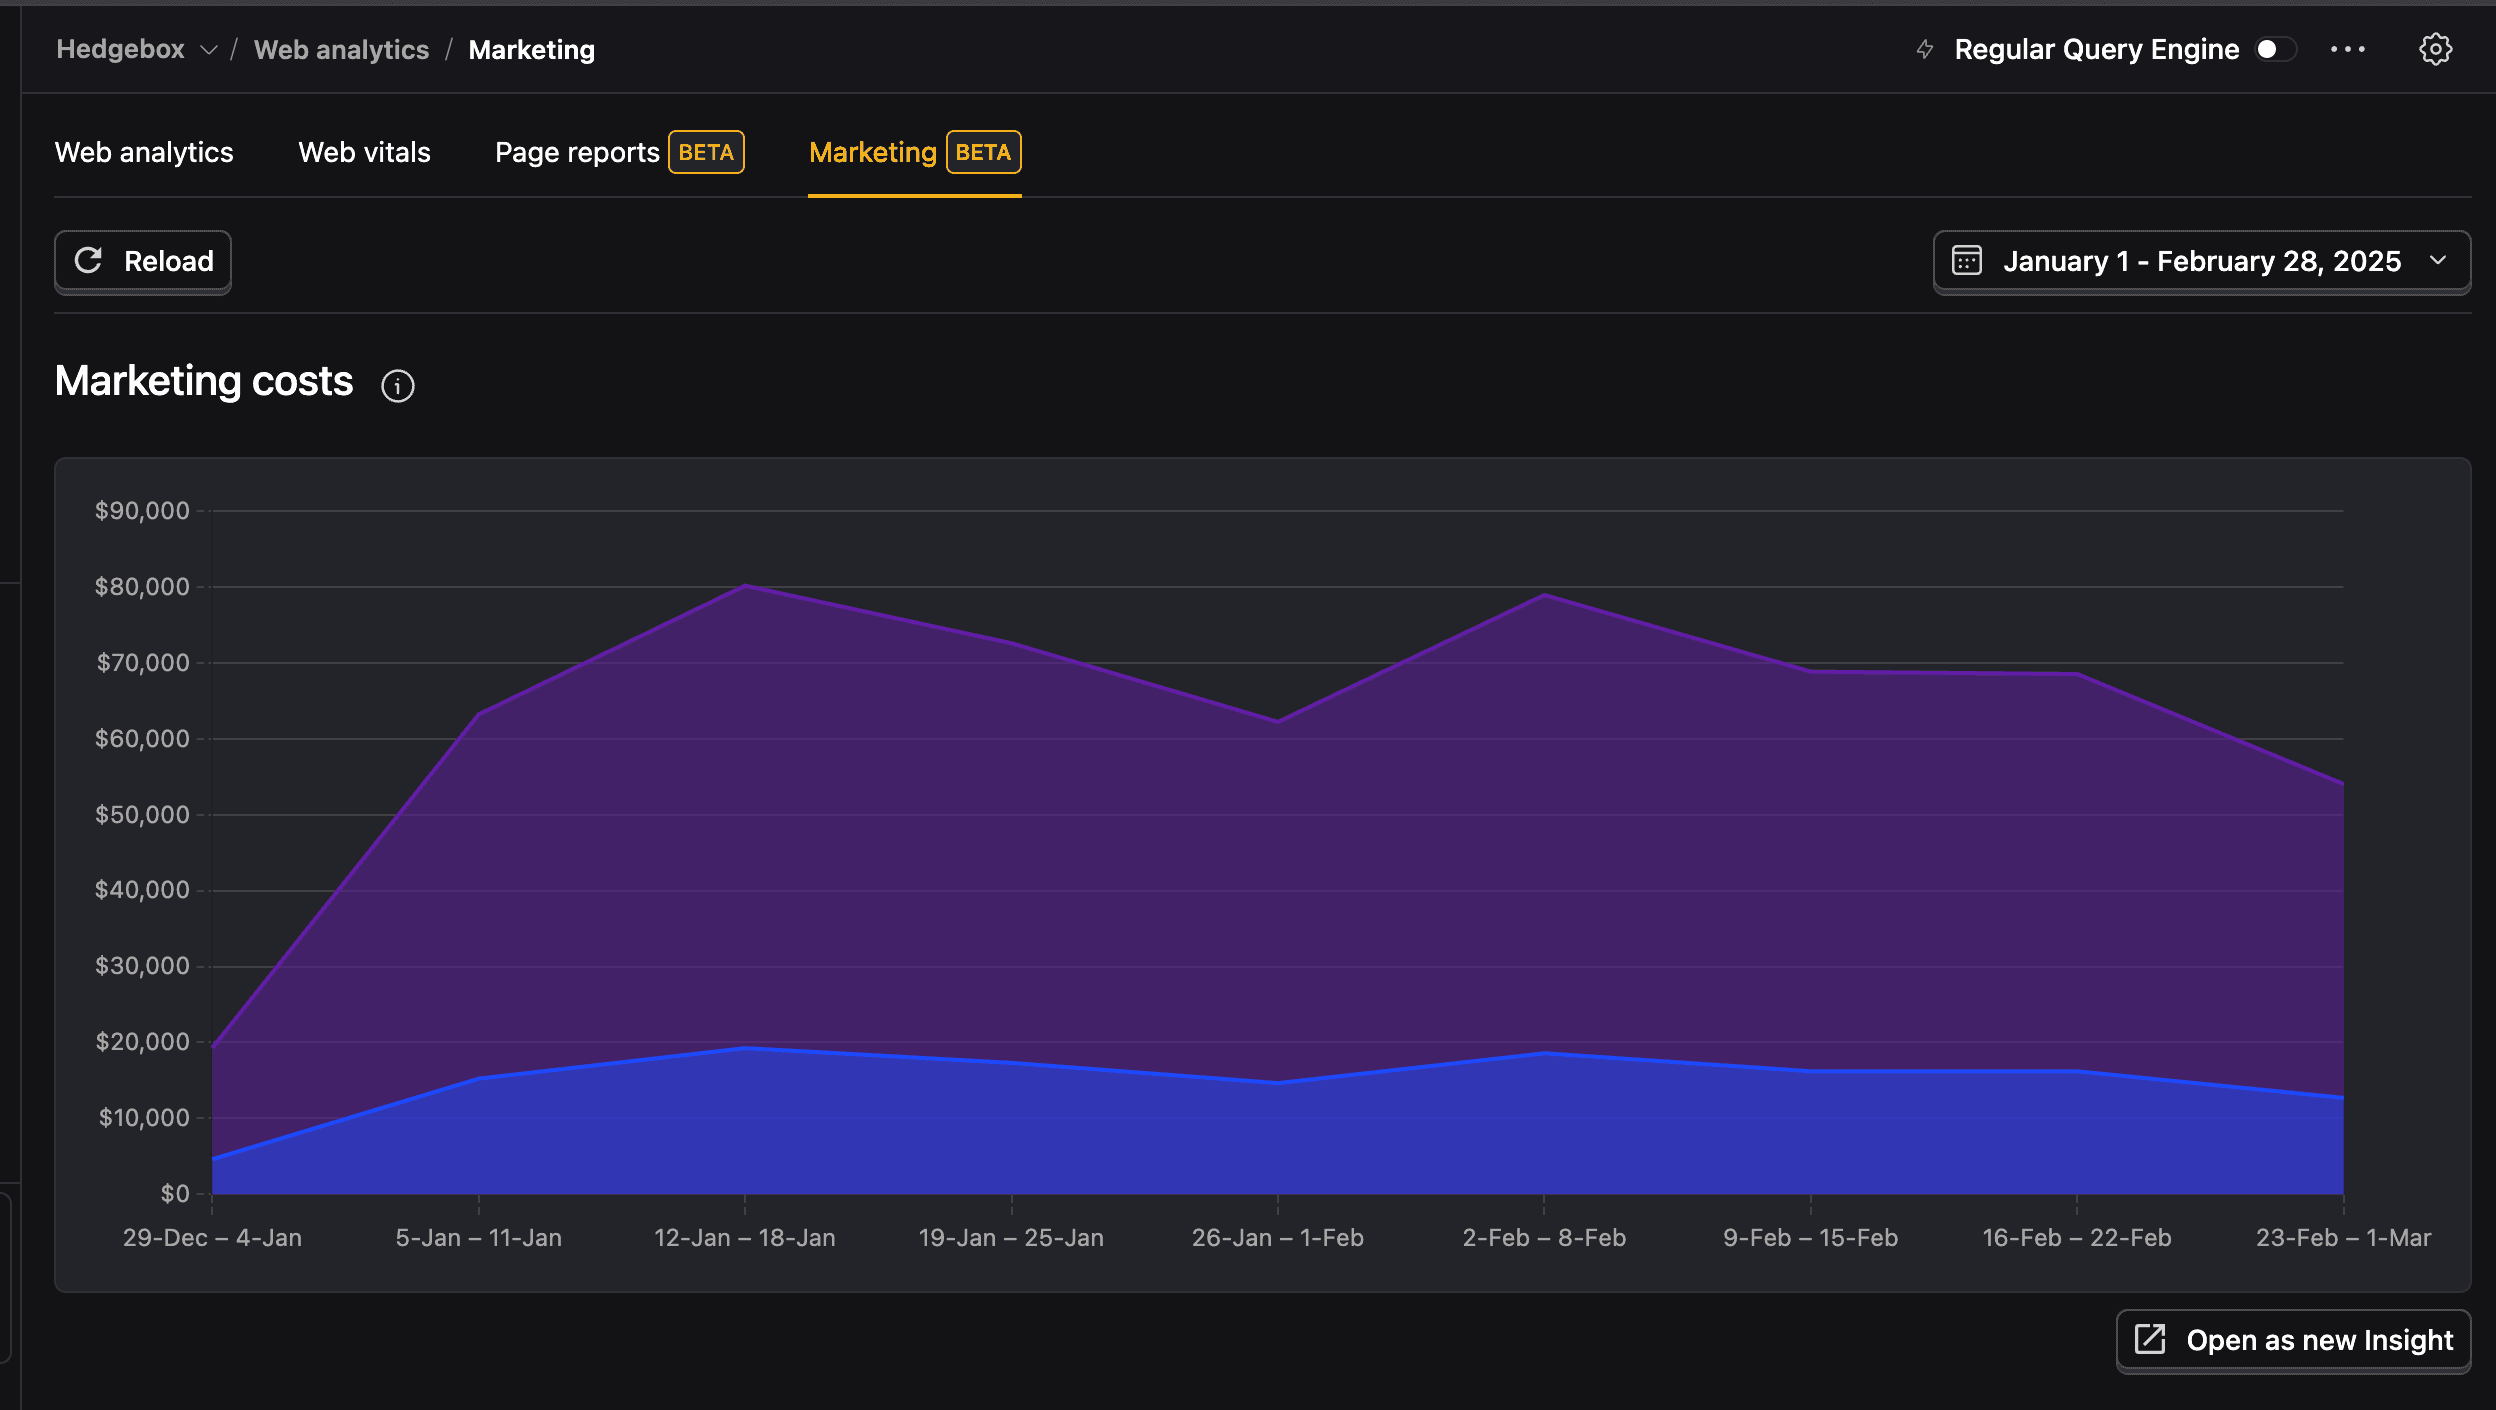
The marketing costs chart displays your total advertising spend across all configured data sources:
- Stacked area visualization shows the contribution of each platform to your total marketing spend
- Time-based trends help identify spending patterns and budget allocation over the selected date range
- Date range filtering allows you to analyze costs for specific periods using the date picker
- Real-time updates reflect new cost data as it syncs from your configured marketing sources (based on your source sync configuration)
- Currency conversion automatically converts all costs to your configured base currency for consistent reporting
Campaign breakdown
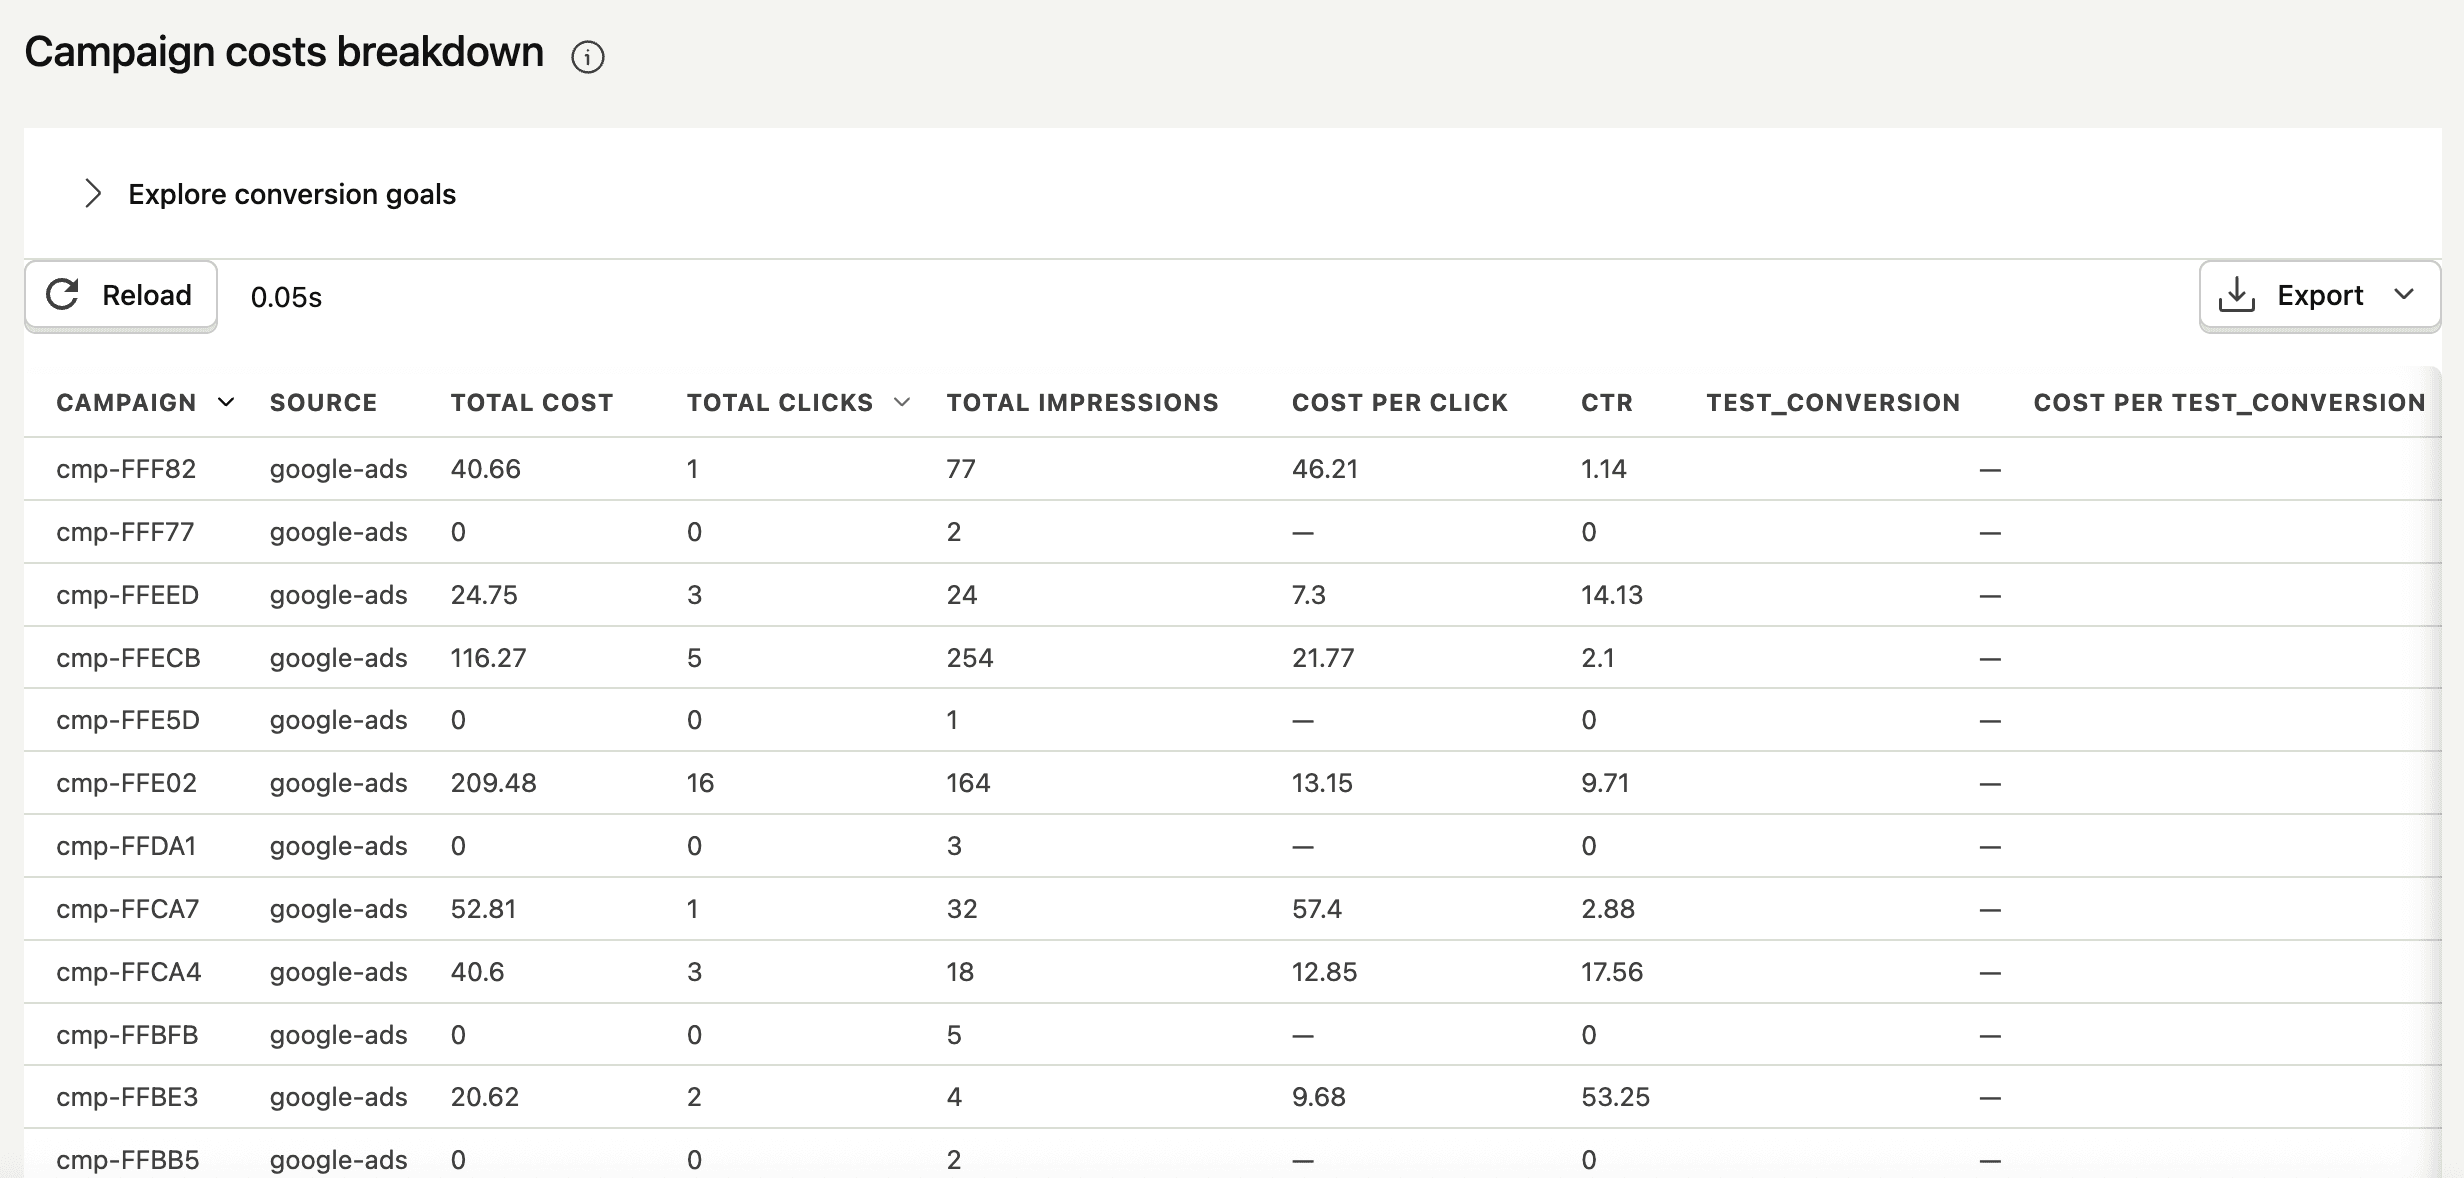
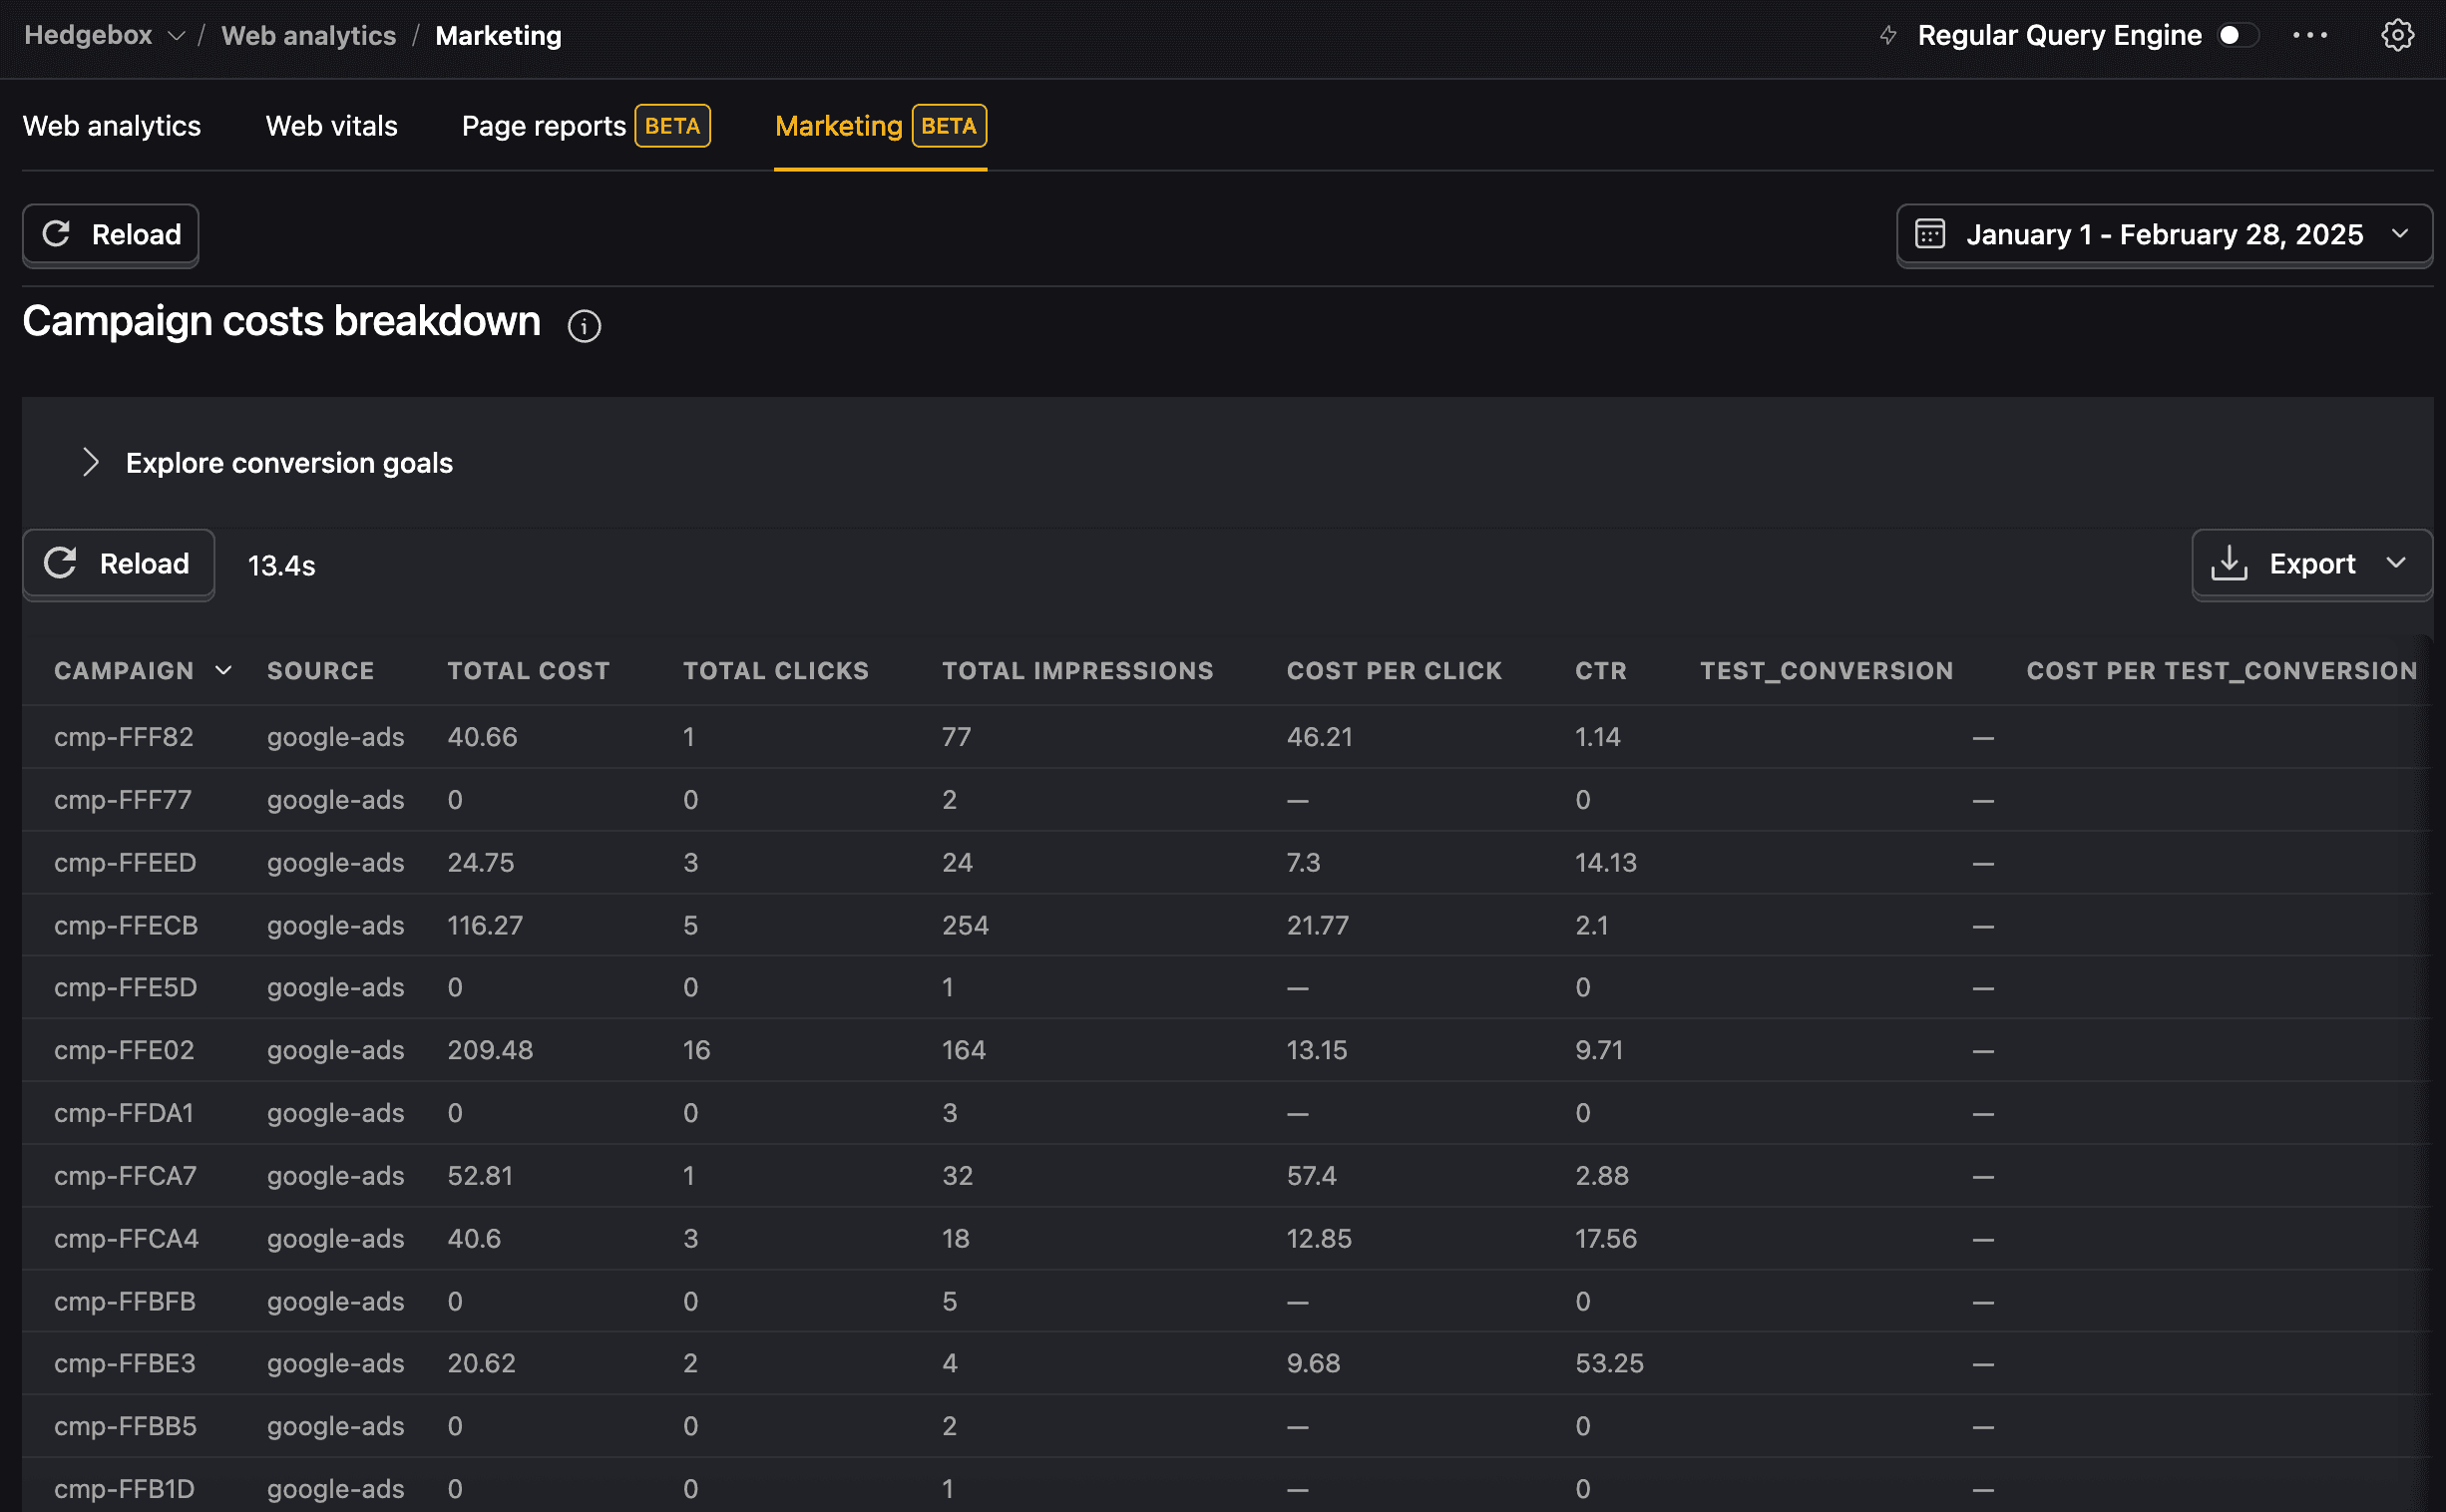
The campaign breakdown table provides detailed performance metrics by individual campaign:
- Campaign: Campaign identifier from your advertising platform (must match the
utm_campaignvalue in your conversion events) - Source: Ad platform name (e.g.,
google, must match theutm_sourcevalue in your conversion events) - Total cost: Total spend for the campaign in your base currency
- Total clicks: Number of clicks received during the selected period
- Total impressions: Number of impressions served
- Cost per click: Average cost per click (total cost ÷ total clicks)
- CTR: Clickthrough rate percentage (total clicks ÷ total impressions × 100)
- Conversion goals: Performance against your defined conversion goals
- Cost per conversion: Cost efficiency for conversions (total cost ÷ conversions)
Settings and configuration
Data source configuration


PostHog supports three types of data sources for marketing analytics. All sources are configured through a unified interface that shows the connection status, required table syncing, and column mapping for each source type.
If you haven't configured any data sources, you'll see an error banner prompting you to add at least one native integration or connect a data warehouse source.
Native sources
PostHog can automatically sync marketing data from supported advertising platforms. You'll need to sync the required tables for each source to enable the functionality.
Supported native sources:
| Platform | Setup Guide | Required Tables |
|---|---|---|
| Google Ads | Setup guide | campaign and campaign_stats |
| LinkedIn Ads | Setup guide | campaigns and campaign_stats |
| Meta Ads | Setup guide | campaigns and campaign_stats |
| TikTok Ads | Setup guide | campaigns and campaign_report |
| Reddit Ads | Setup guide | campaigns and campaign_report |
Each native source automatically handles data formatting and provides the required campaign and performance data. The configuration interface shows which tables are syncing and which still need to be enabled.
Data warehouse sources
You can optionally connect external data warehouse sources (currently BigQuery) to display marketing analytics. You'll need to map the required columns for each table to enable the functionality.
Required field mappings:
- Campaign: Campaign identifier or name (mapped to
utm_campaignquery param) - Cost: Cost amount for the period
- Date: Date of the data record
- Source: Platform name (mapped to
utm_sourcequery param)
Optional field mappings:
- Clicks: Number of clicks received
- Currency: Currency code for cost values
- Impressions: Number of impressions served
Self-managed sources
You can configure self-managed sources from S3, GCS, Cloudflare R2, and Azure. Like data warehouse sources, you'll need to map the required columns for each table to enable the functionality.
We strongly recommend using JSON format for better support and troubleshooting. You simply need to create a connection between PostHog and your marketing source, map the desired fields, and PostHog will use the marketing data directly from that source.
Please refer to the data pipeline docs for more information on configuring external data sources.
Conversion goals
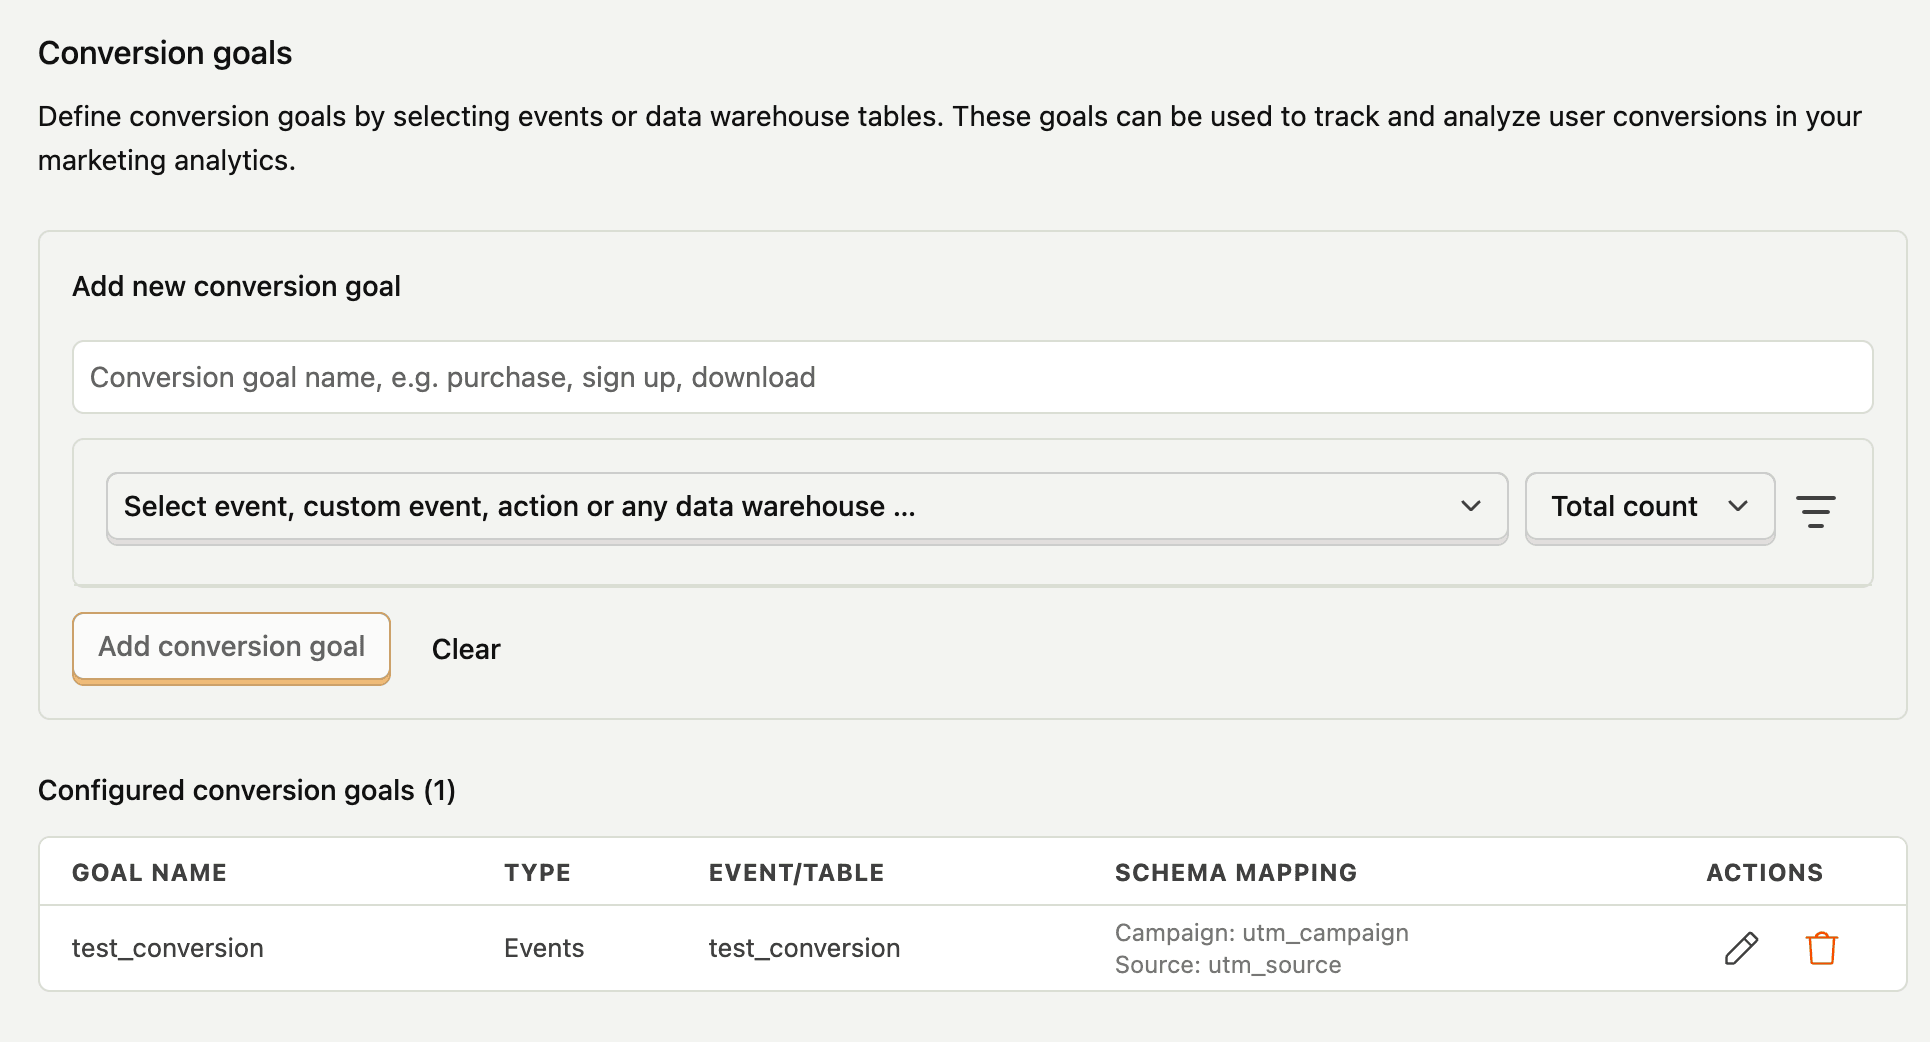
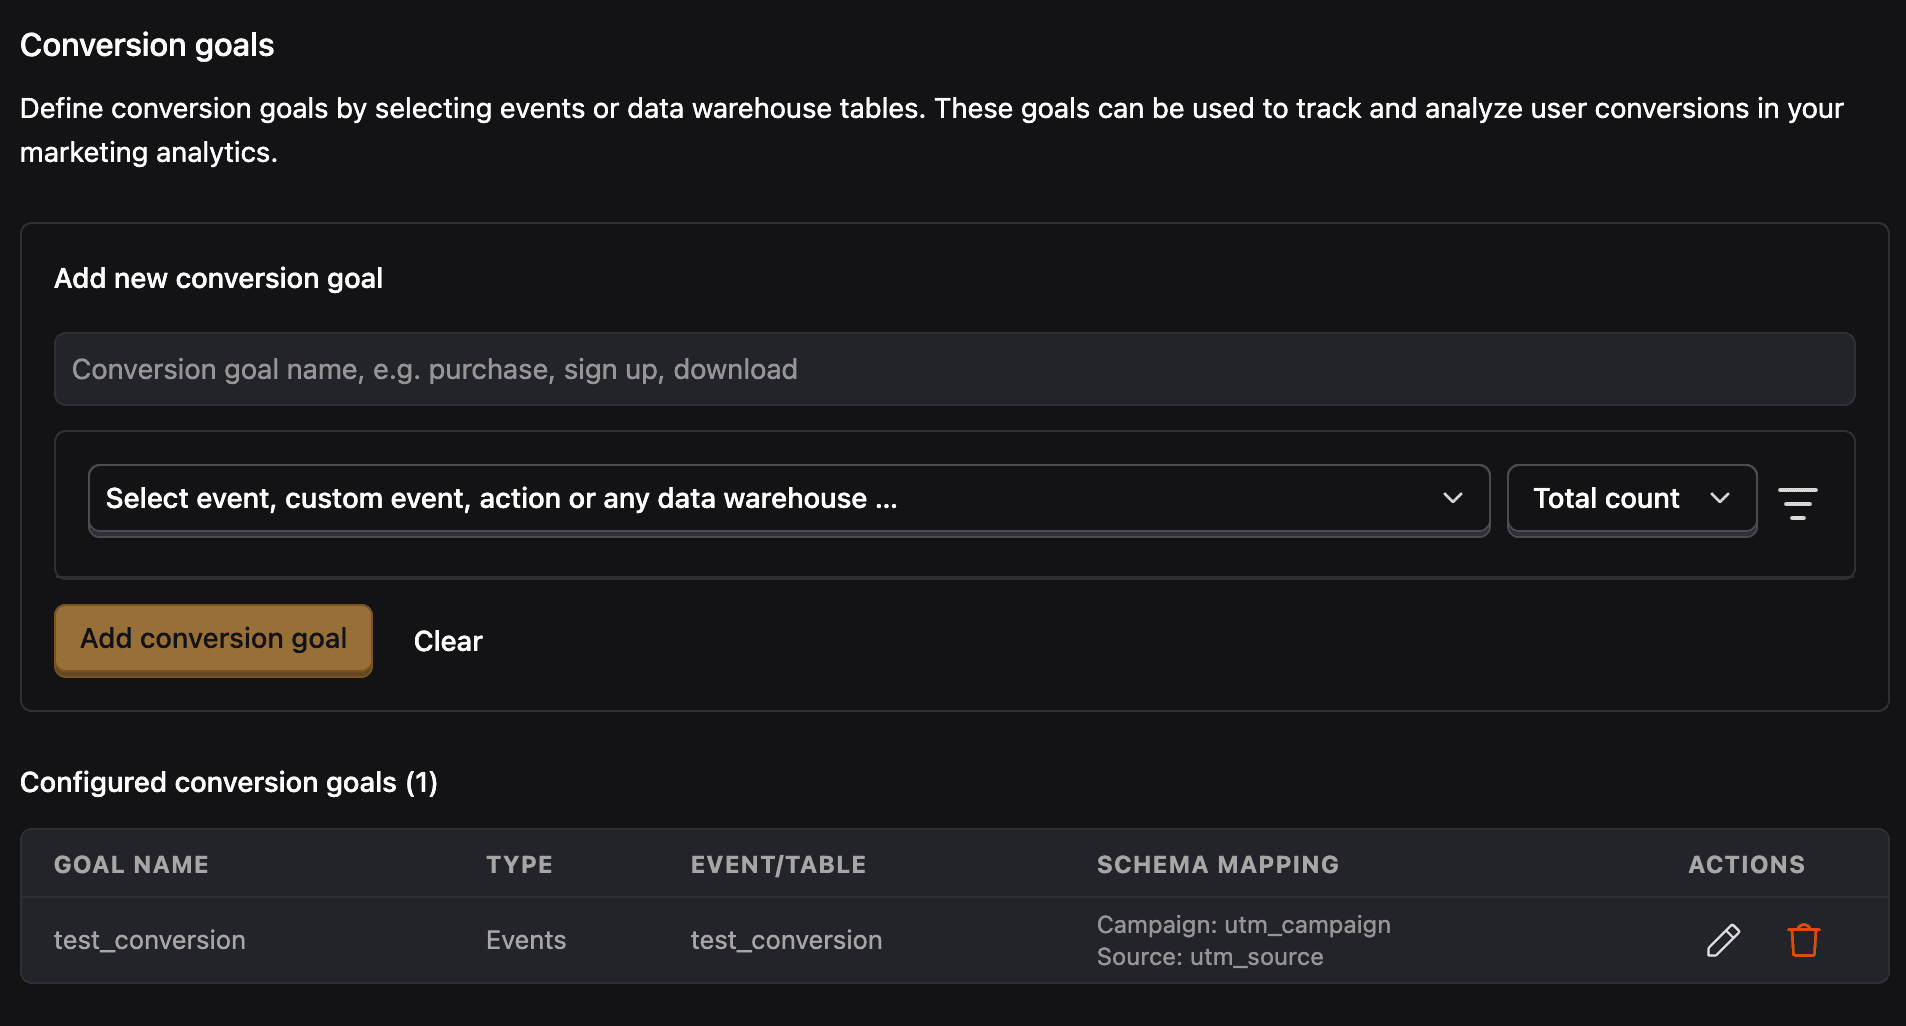
Define conversion goals by selecting events, actions, or data warehouse tables. These goals are used to track and analyze user conversions in your marketing analytics.
To configure conversion goals, select:
| Configuration Field | Description |
|---|---|
| Conversion goal name | Descriptive name (e.g., purchase, sign up, download) |
| Event, action or data warehouse table | Select what to track for conversions |
| Schema mapping | For data warehouse tables, map campaign and source attribution fields. For events, PostHog uses UTM parameters: utm_campaign and utm_source |
For data warehouse table conversion goals, you'll need to map the following required fields:
| Required Field | Description |
|---|---|
| UTM Campaign Name | Maps to the utm_campaign parameter for attribution |
| UTM Source Name | Maps to the utm_source parameter for attribution |
| Timestamp Field | Date/time field for the conversion event |
| Distinct ID Field (optional) | User identifier for conversion tracking |
Advanced settings

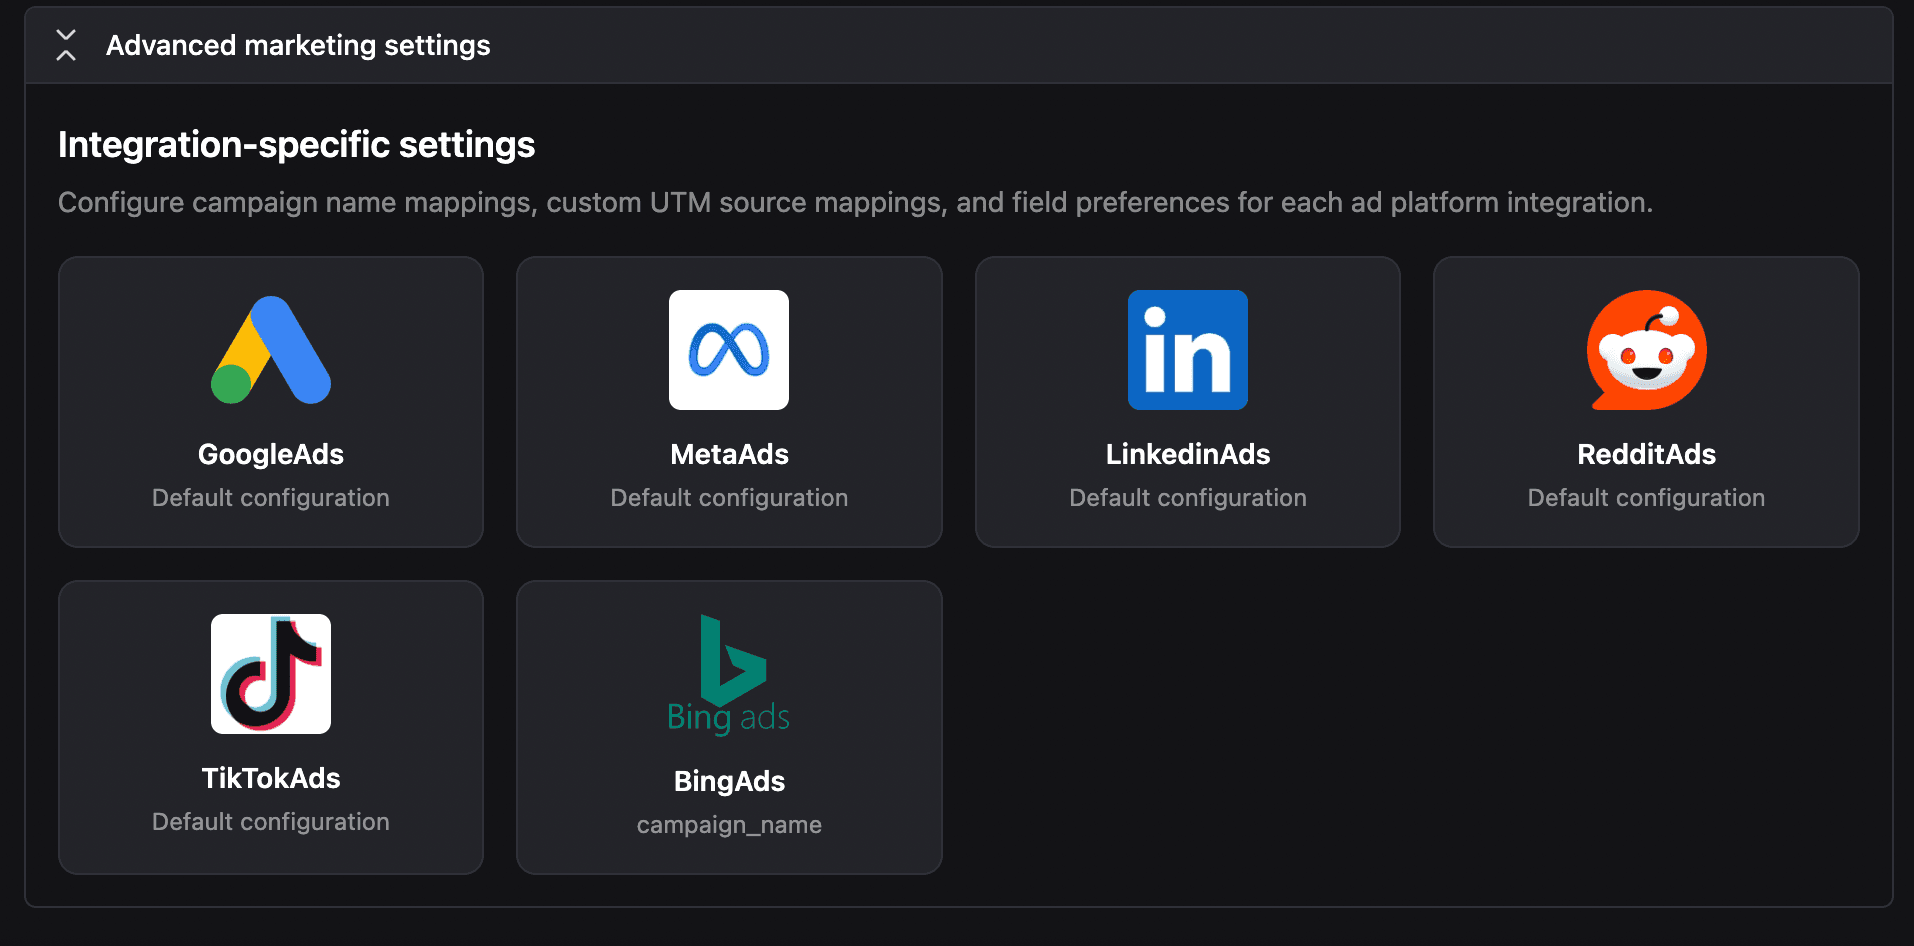
Configure how PostHog maps campaign data from your advertising sources to your conversion events. These settings give you granular control over how campaign identifiers and sources are matched for attribution.
Campaign field preference
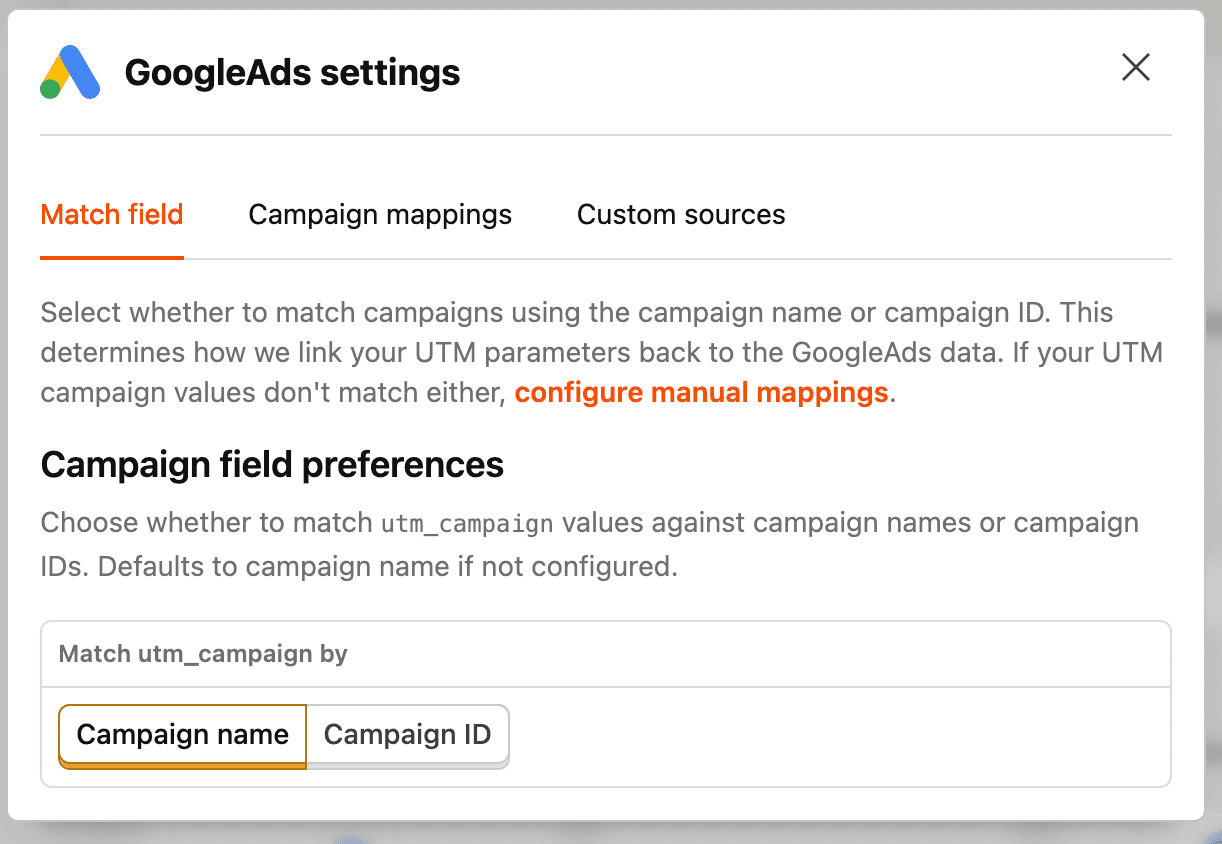
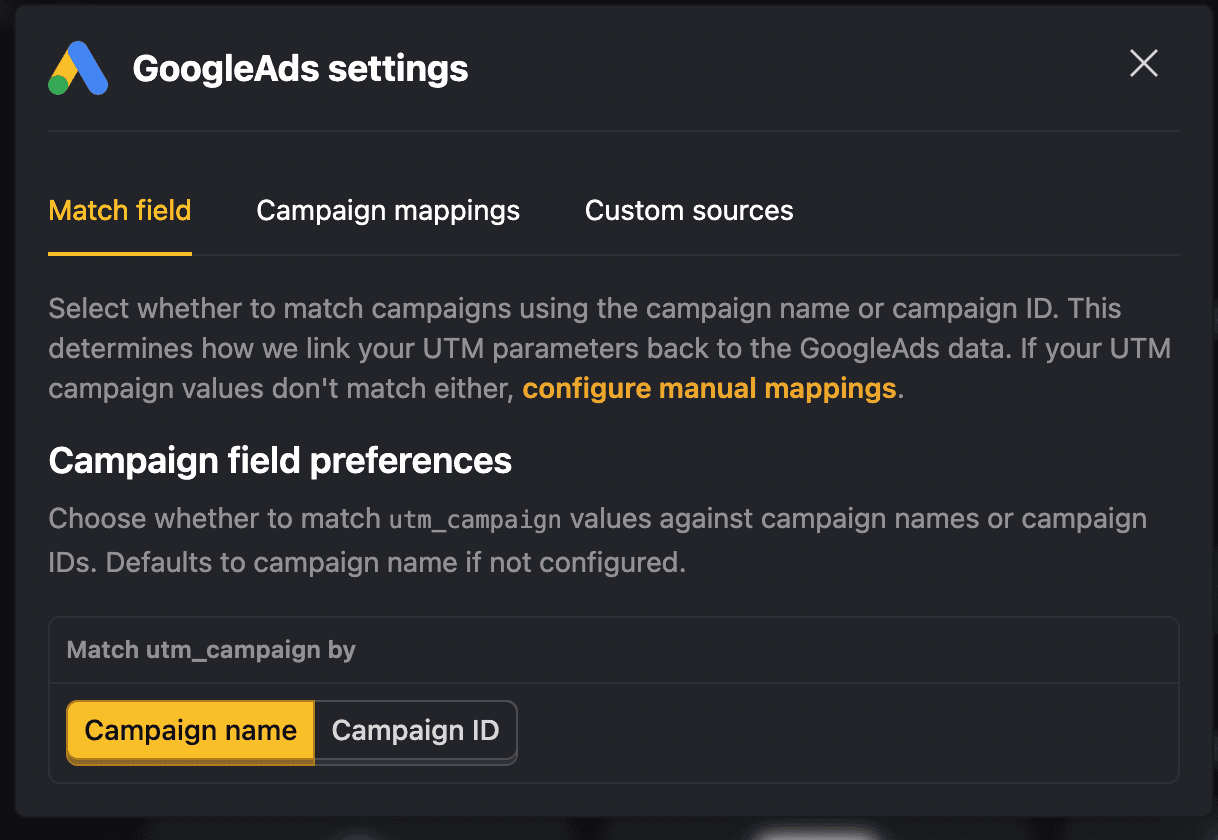
For each advertising platform, you can choose whether to map campaigns using the campaign name or campaign ID:
- Campaign name: Uses the human-readable campaign name from your ad platform (e.g., "Summer Sale 2025")
- Campaign ID: Uses the platform's unique campaign identifier (e.g., "123456789")
This setting determines which field is matched against the utm_campaign parameter in your conversion events. Choose the option that matches how you structure your UTM parameters.
UTM campaign manual mappings
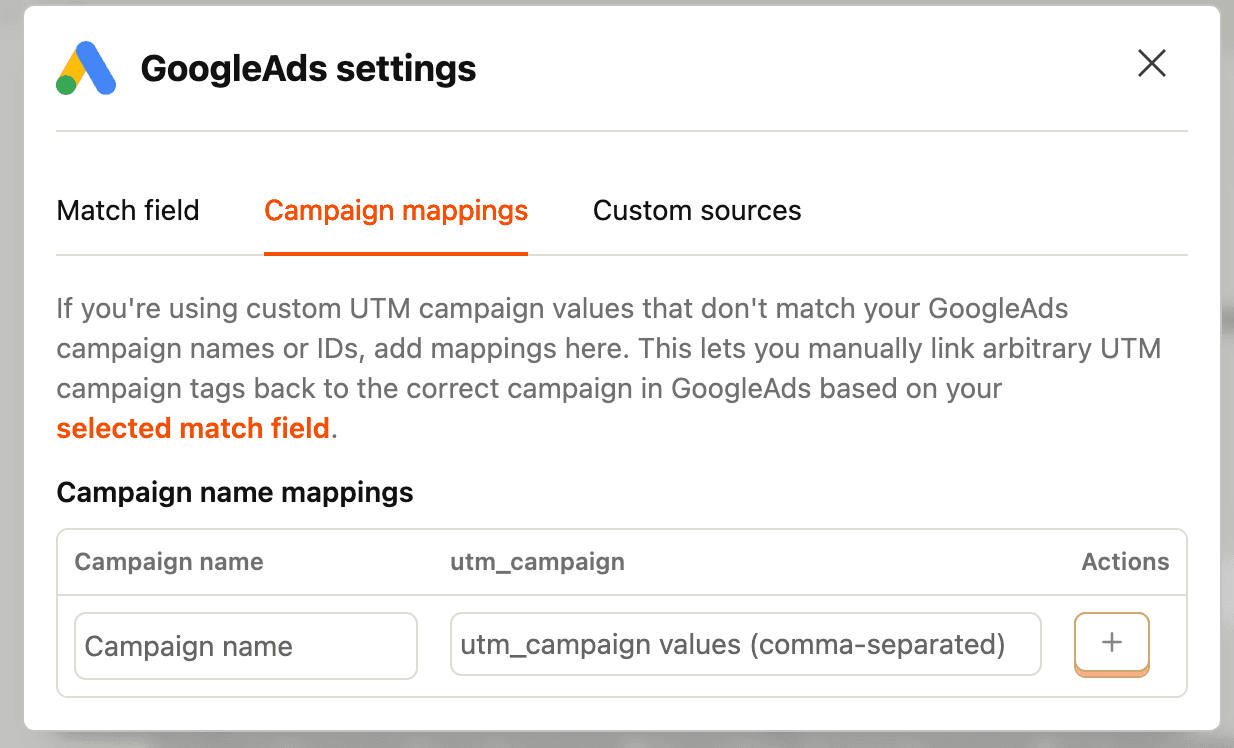
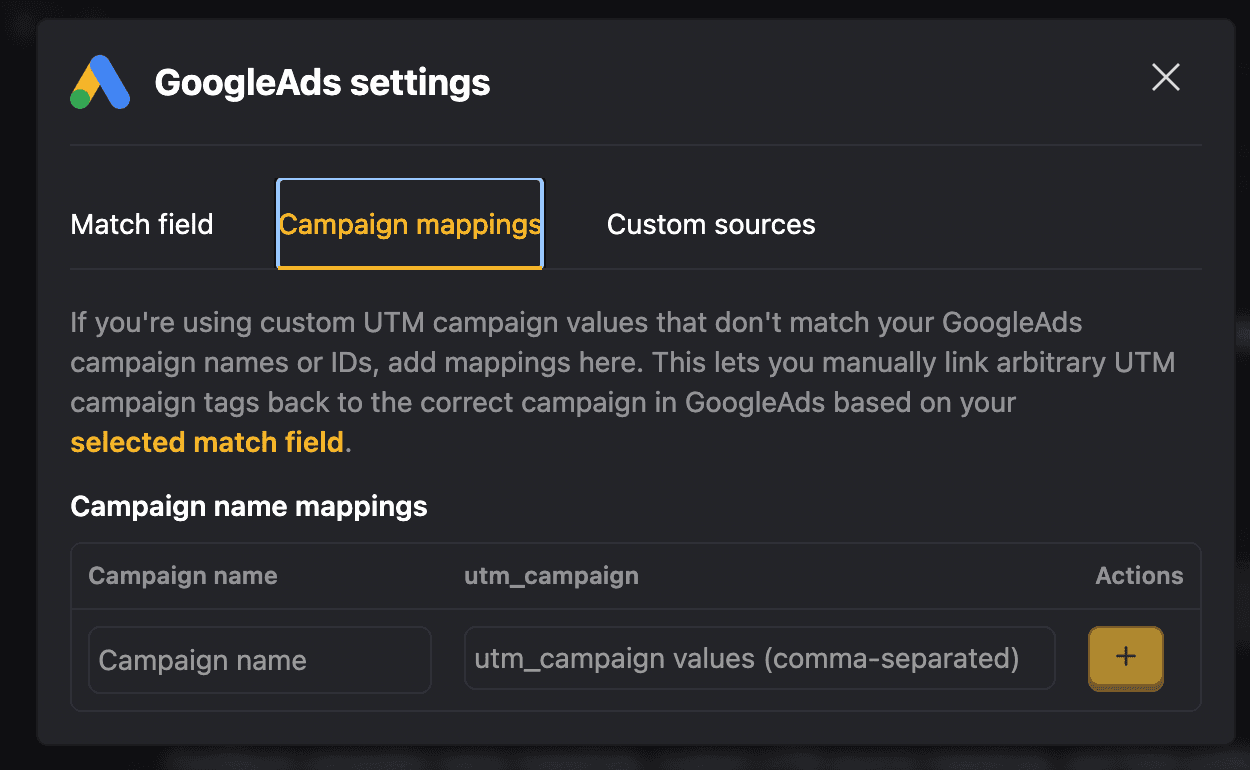
Map arbitrary utm_campaign values to specific campaign names or IDs from your advertising platforms. This is useful when:
- Your UTM parameters use different naming conventions than your campaign name or ID
- You want to consolidate multiple campaign variations under a single campaign
- You're tracking campaigns across multiple channels with different UTM campaign naming
For example, you can map utm_campaign=summer-promo to the Google Ads campaign named "Summer Sale 2025" or to campaign ID "123456789", depending on your campaign field preference.
Custom source mappings

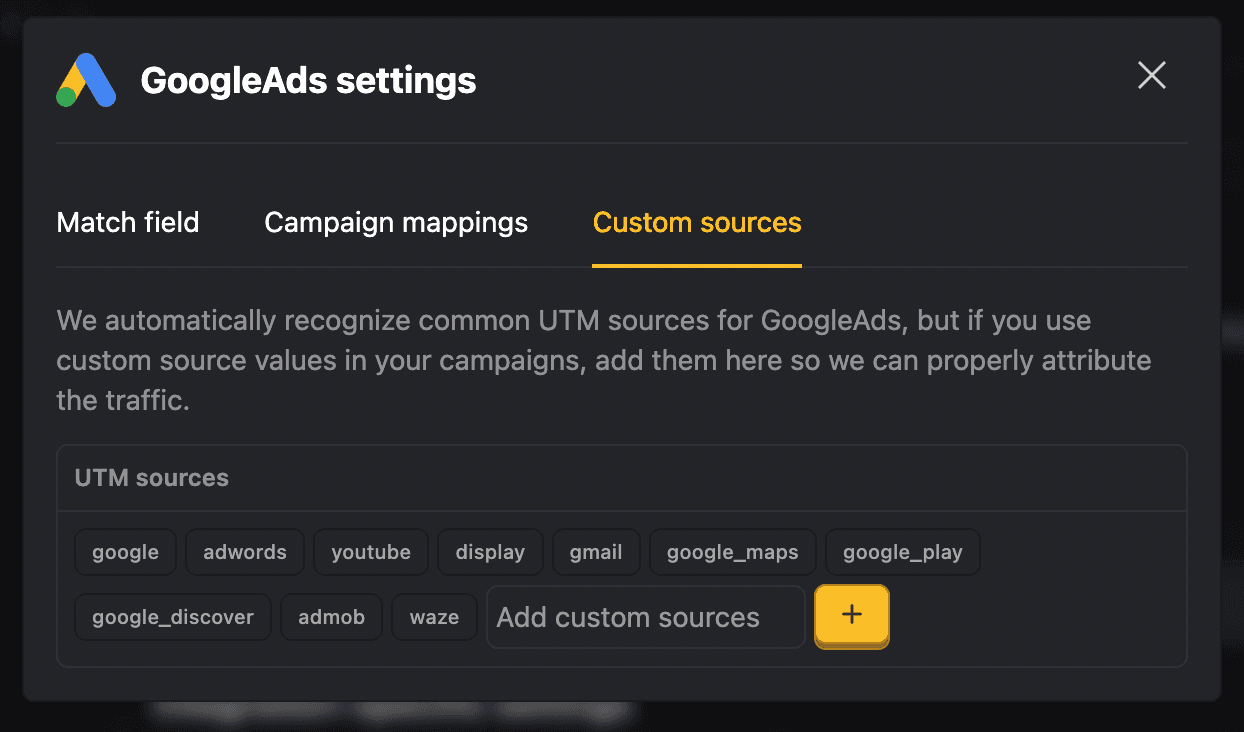
Control which UTM sources are attributed to each advertising platform integration. For each platform (Google Ads, LinkedIn Ads, Meta Ads, etc.), you can:
- Whitelist specific sources: Define which
utm_sourcevalues should be attributed to this platform - Support multiple sources: Map multiple UTM source values to a single advertising platform
This is particularly useful when:
- You use custom UTM source values that don't match the default platform names
- A single campaign spans multiple traffic sources
Example configuration:
- Google Ads integration: Whitelist sources
google,google_ads,paid_search - LinkedIn Ads integration: Whitelist sources
linkedin,li,linkedin_paid - Meta Ads integration: Whitelist sources
facebook,instagram,meta
Base currency
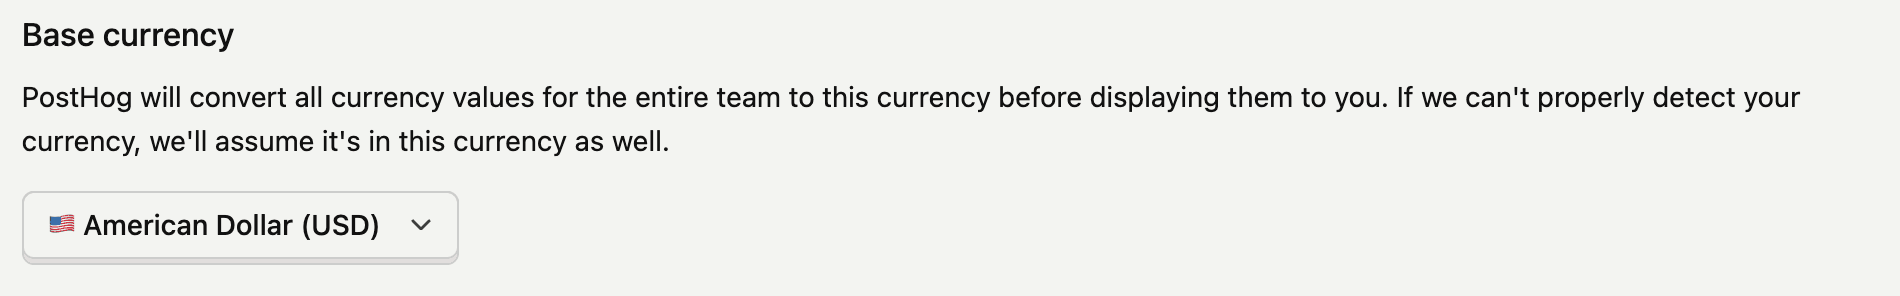

PostHog converts currency values for the entire team to the base currency you set in your project settings before displaying them. If we can't properly detect your currency from the source data, we'll assume it's in the base currency as well.