


Activity tab
Contents
The activity tab is a customizable list of events that you've captured. It's great for checking events are being captured, debugging captured events, and being a jumping off point for further analysis. You can expand each event to its specific properties, metadata, raw JSON, and feature flags.
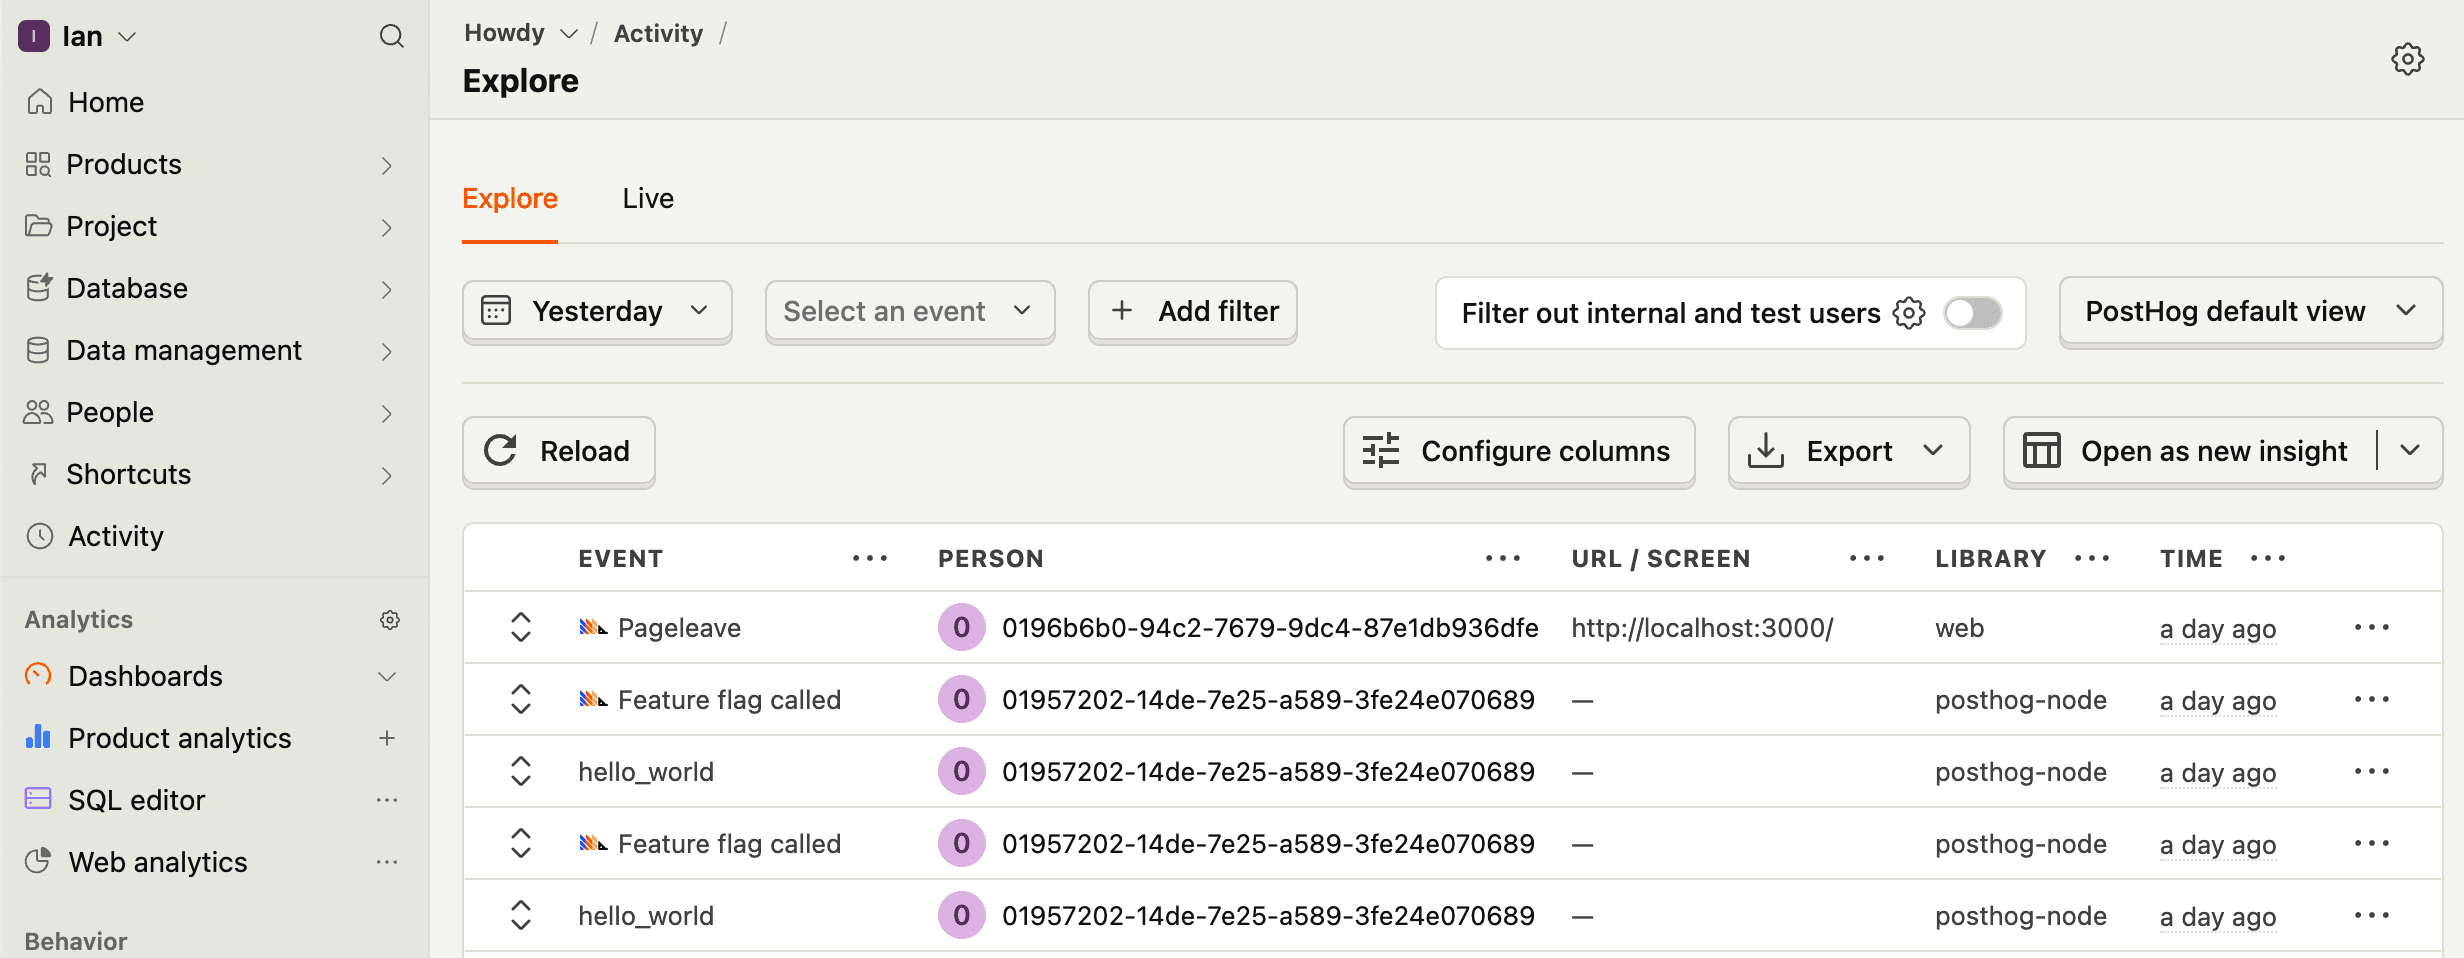
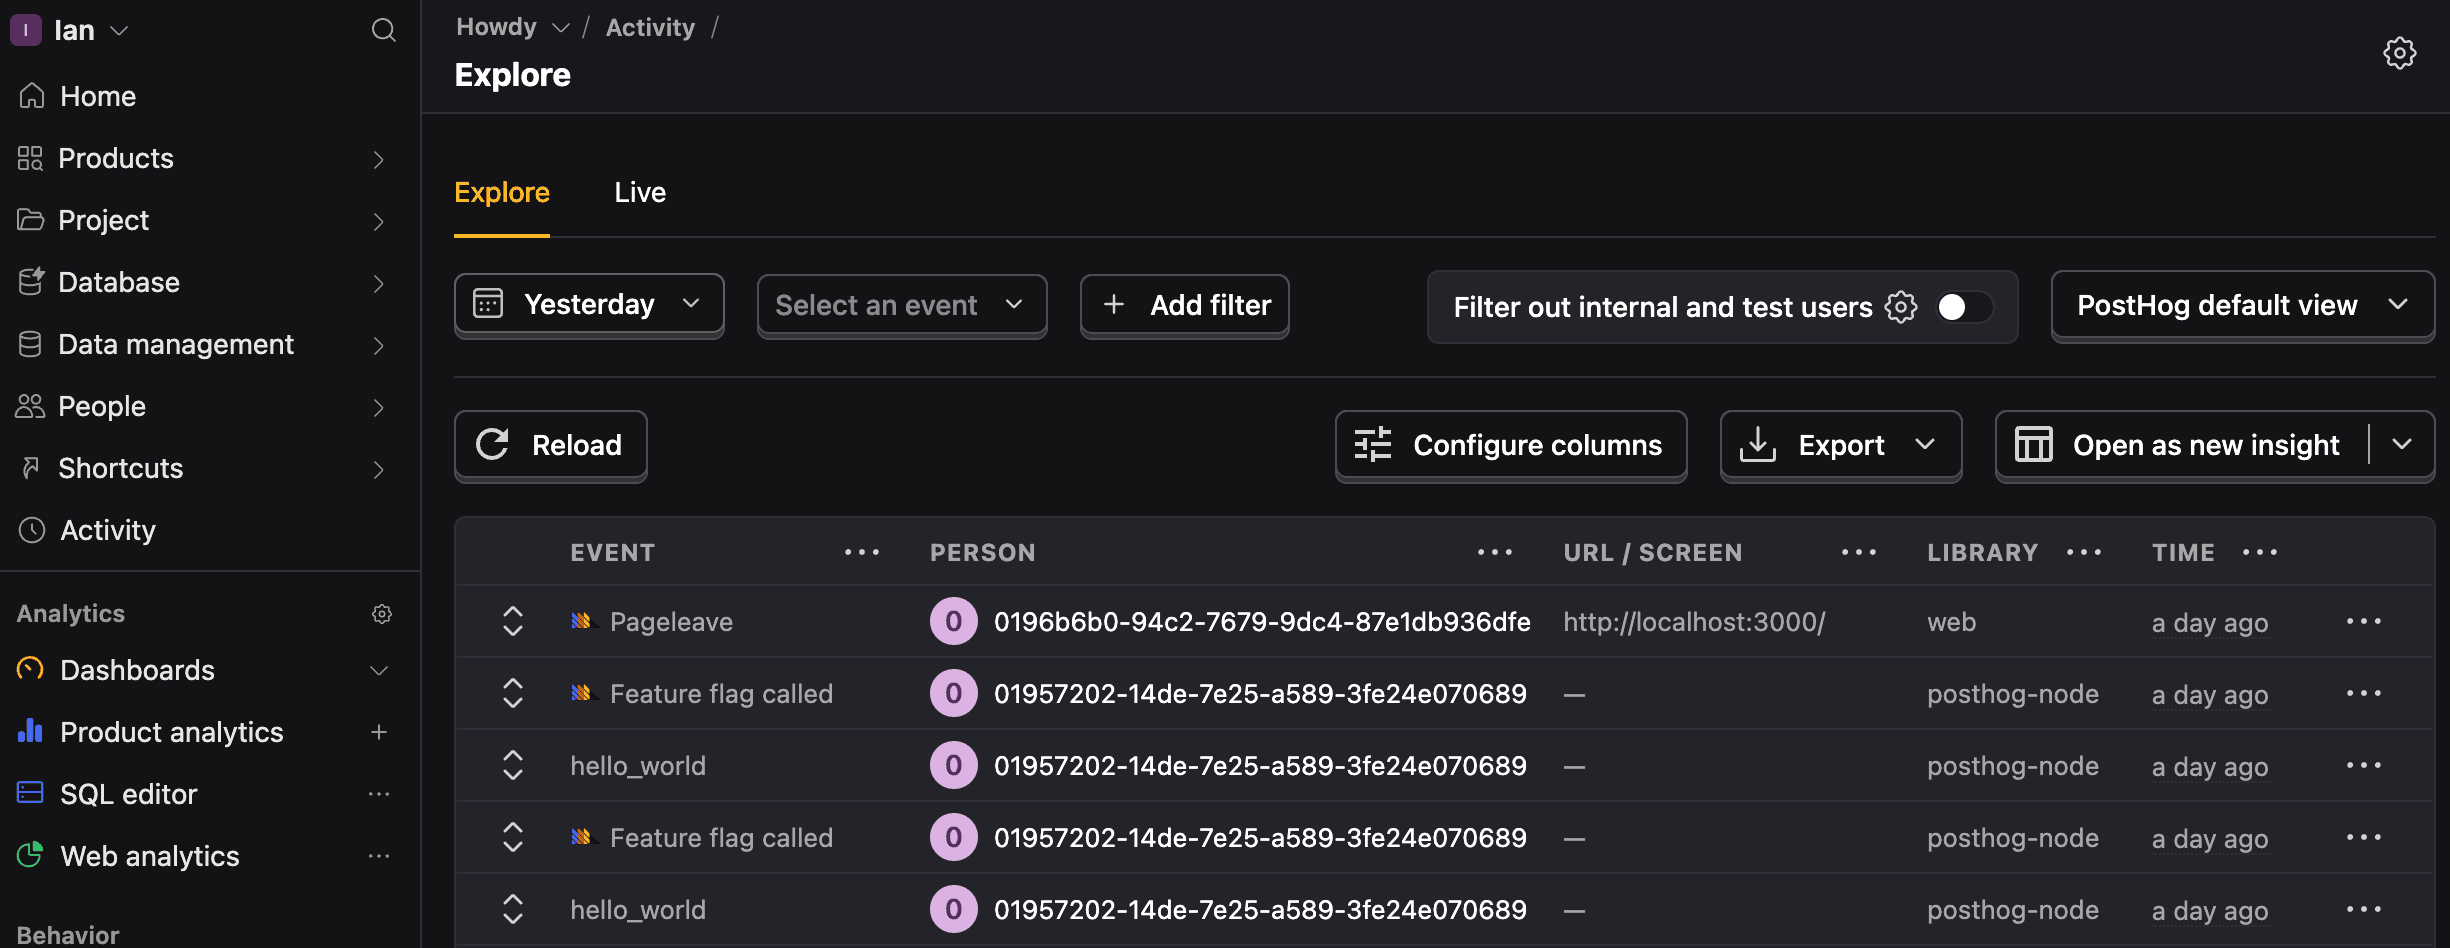
The options for customization on the activity tab include:
Filtering by date, event, properties, and more.
Customizing the columns shown. These can include event properties, person properties, feature flags, and even SQL queries. You can reorder them and set your customization as the default for all project members.
For example, to show an absolute timestamp like Jul 16, 09:12:55, you can add an SQL expression like formatDateTime(toTimeZone($timestamp, 'America/Chicago' ), '%b %d, %H:%i:%s').
Activity views
The activity tab also has multiple views:
PostHog default: Shows a list of events with their person, URL or screen, library, and time.
Project default: Shows a list of events with the configured columns you set.
Event count: Shows each event along with the number of times it's been captured.
Live: Shows a live feed of events as they are captured as well as the number of currently active users. This can be filtered for a specific event or paused.