


How to set up a React app heatmap with PostHog

Contents
Understanding where users click your site or app shows you what interests them. A heatmap can visualize these clicks to make this analysis easier.
To help you get started, this tutorial will walk through setting up a React app with Vite, adding PostHog, accessing the heatmap, and customizing the heatmap to your needs.
Creating a React app with Vite
First, install Node, then create a React app with Vite in your terminal, and name it whatever you want (we name ours heatmap).
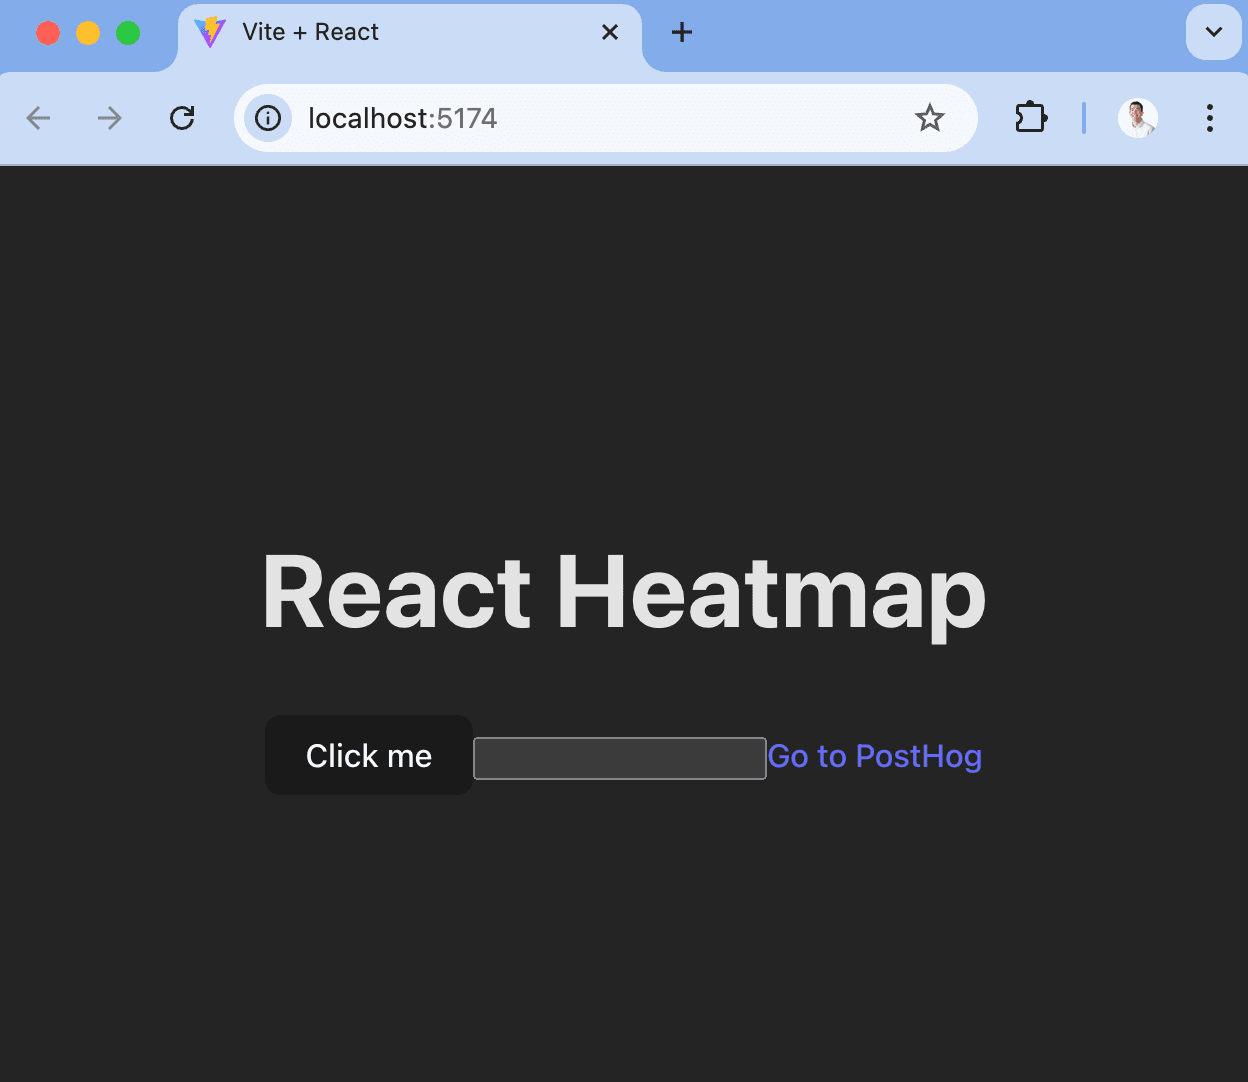
Next, in src/App.jsx, replace the existing code with buttons, inputs, and links we can click like this:
When we run npm run dev, this gives us a basic React app which we can use to test PostHog's heatmap functionality.
Adding PostHog
Next, we will add PostHog to your React app. This requires a PostHog instance, which you can sign up for (for free). Once you have a PostHog instance, go back to your terminal and install posthog-js:
After installing, go to src/main.jsx and set up the PostHog provider. To do this:
- Import
posthogfromposthog-jsand thePostHogProviderfrom@posthog/react - Initialize
posthogwith your project API key and host from your project settings. - Wrap your
Appcomponent in thePostHogProviderwith the initializedposthogas aclientproperty
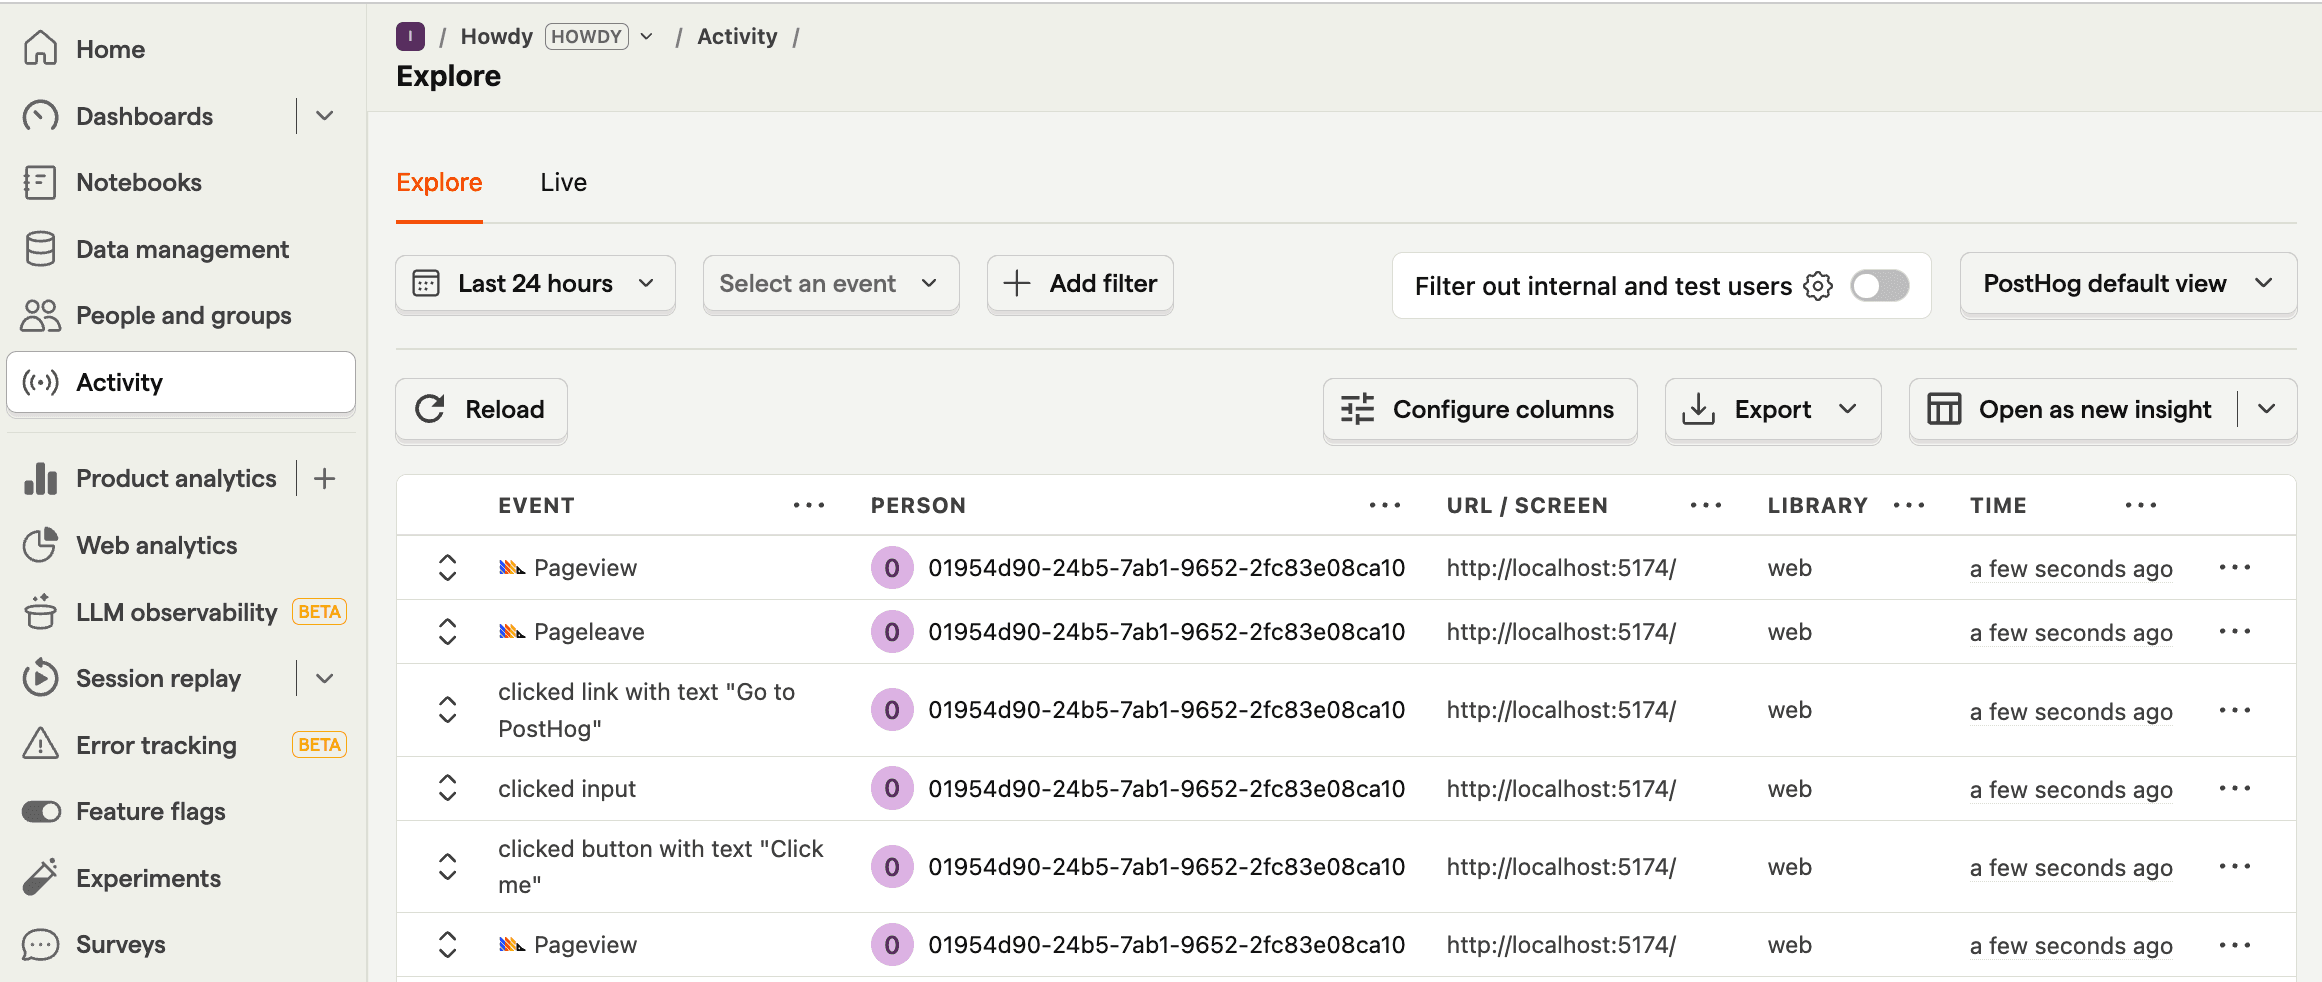
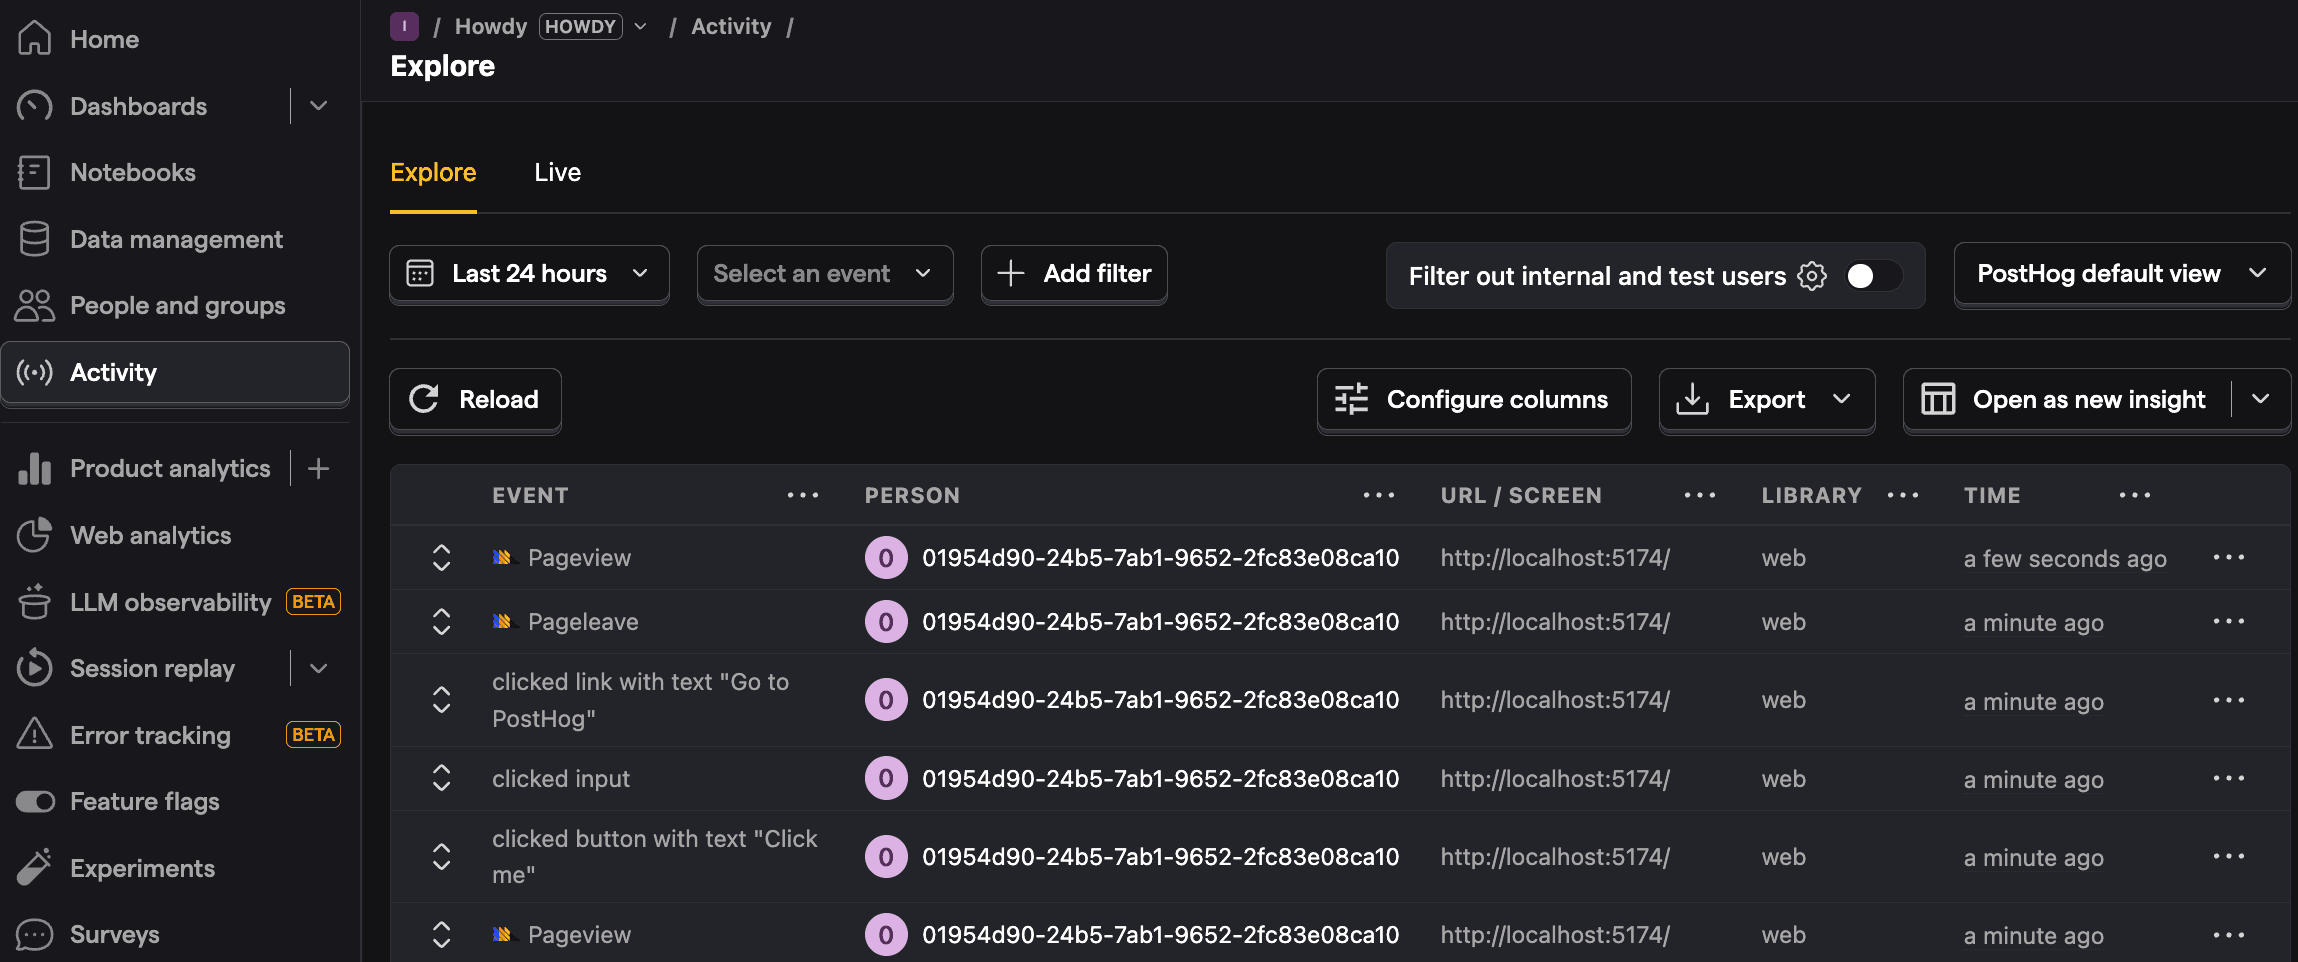
Once done, run npm run dev again then go to your app and click the button, enter some text into the input, and click the link. You should see events for these in your PostHog instance.
Launching your toolbar to access the heatmap
With our React app and PostHog set up as well as some data, we can get a heatmap of this data using the toolbar.
In PostHog, click the Toolbar tab on the left menu, then add http://localhost:5173 to the authorized URLs, and click Launch. This takes you to your site with the PostHog toolbar active.
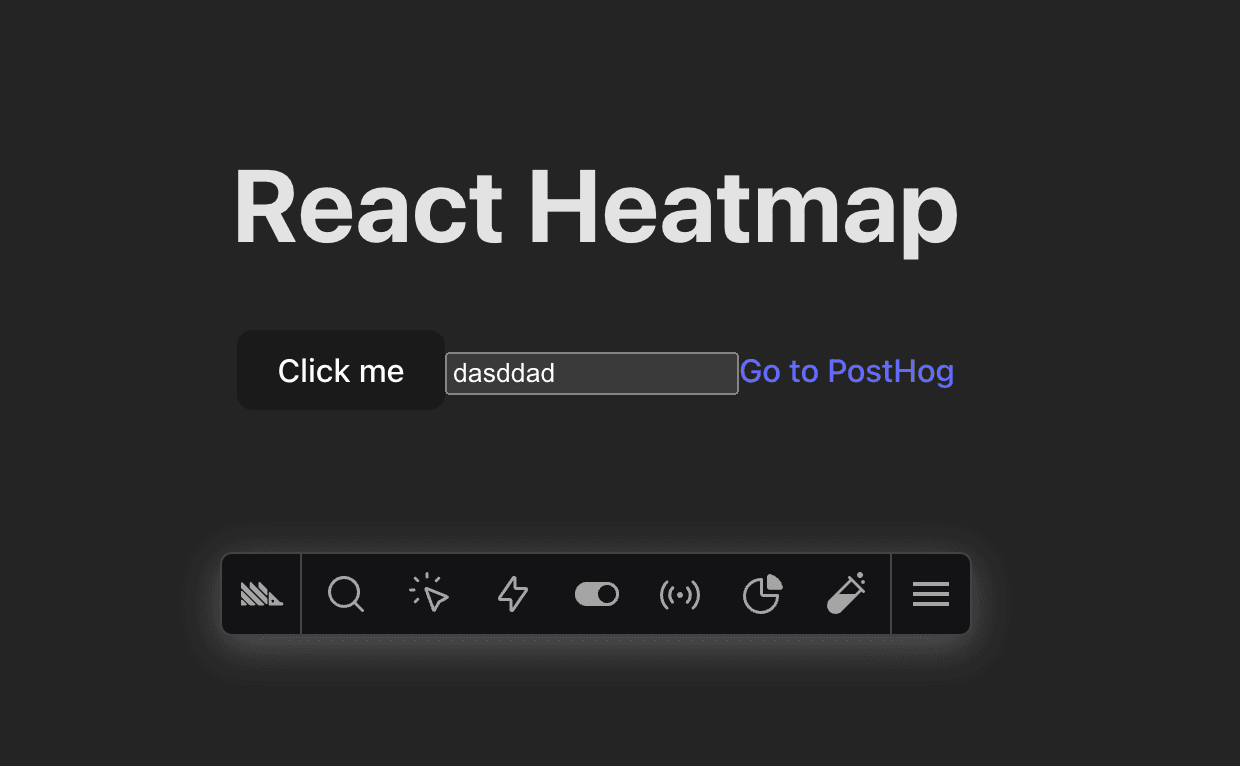
To activate the heatmap, click the heatmap icon in the toolbar. This highlights the areas of your app that users are clicking on. For this tutorial, we also recommend enabling the Clickmaps option so you can see what elements users are clicking on.
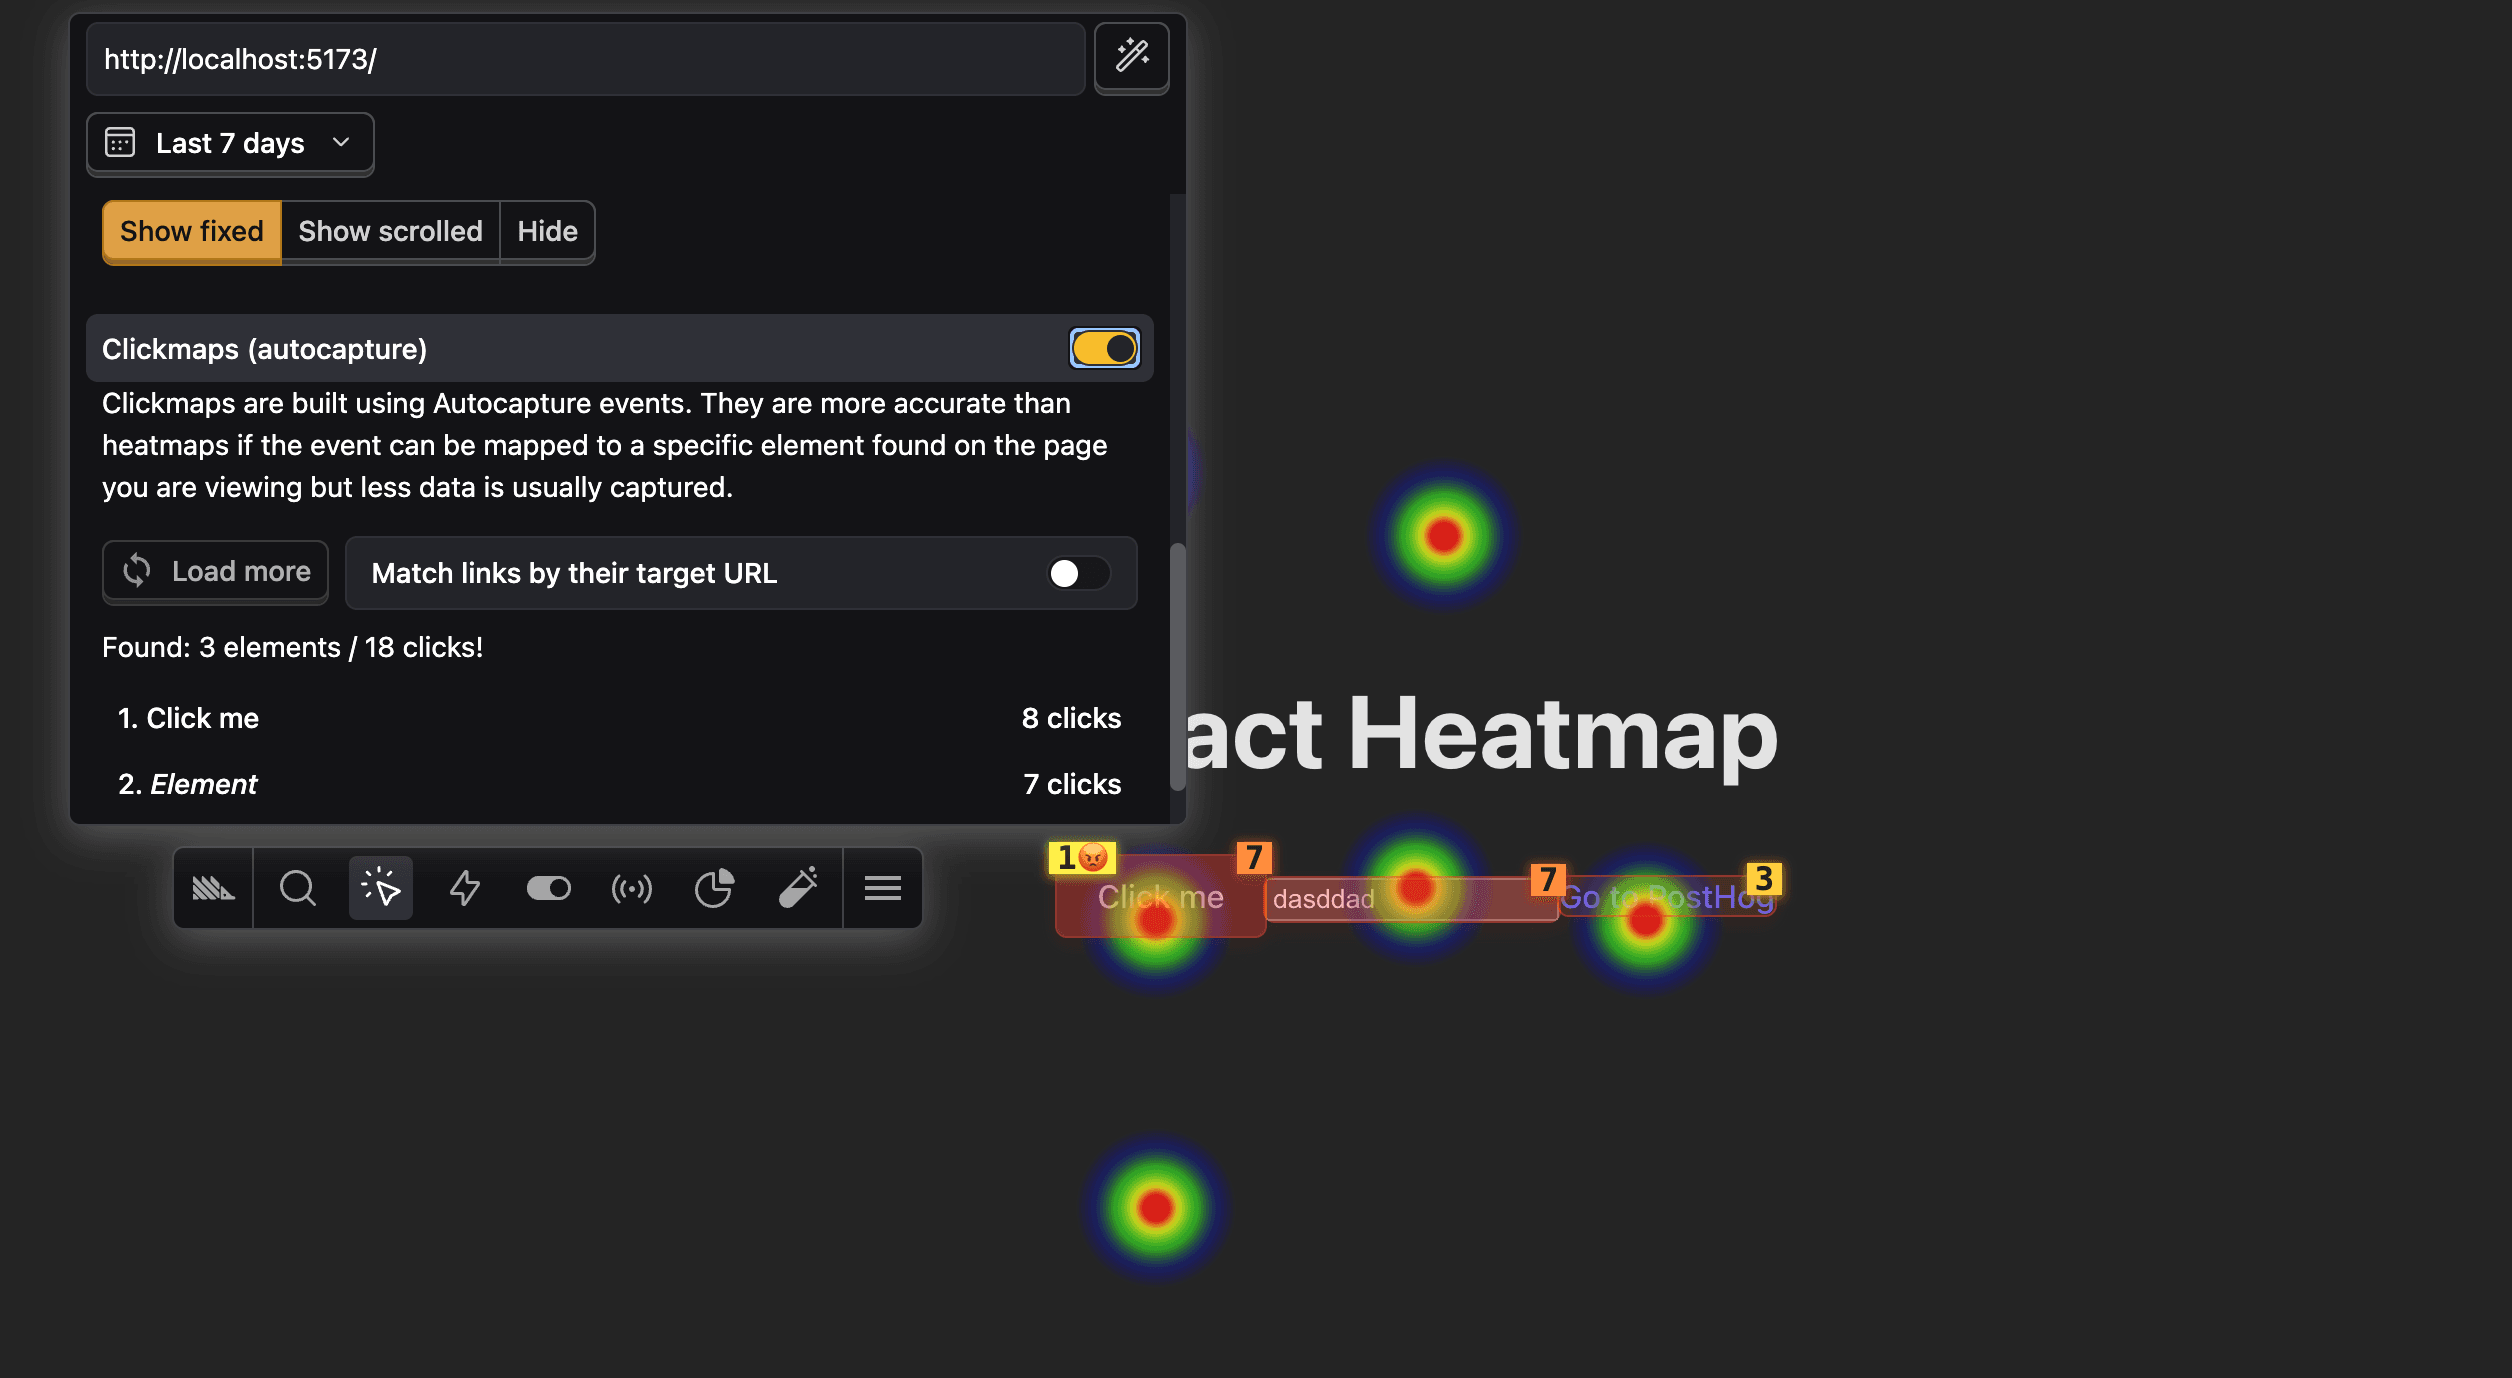
Understanding the heatmap
With the heatmap open, you see both hotspots and clickmaps highlighted in shades of green to red. Here's what the numbers mean:
- The numbers over the elements are how many times they were clicked over the last 7 days.
- The number next to the 😡 emoji is the number of rage clicks for that element.
When you click an element, you get a modal with different options:
- Details about the selected option, like its text and DOM location.
- Stats including clicks and ranking of most clicked on the page.
- The ability to create an action.
Changing the heatmap settings
You can also change the settings for your heatmap by using the menu that appears when you click the heatmap icon. This enables you to:
- Change the events list to contain more pages using wildcards (
*). For example, if you wanted to see the heatmap for the same elements across all blog pages, you could use/blog/*. - Change the length of time the heatmap generates from. The default is 7 days.
- See all the elements in the heatmap and load more.
- Whether to aggregate by event count or unique users.
- Viewport size to include in the heatmap.
Once all these settings are set as you prefer, you've set up a heatmap for your React app. You can use it to analyze user behavior in your app.
Further reading
- Using the PostHog Toolbar to visualize behavior and create actions
- How to create new events the easy way
- How to use session recordings to get a deeper understanding of user behavior

Subscribe to our newsletter
Product for Engineers
Read by 100,000+ founders and builders
We'll share your email with Substack
PostHog is an all-in-one developer platform for building successful products. We provide product analytics, web analytics, session replay, error tracking, feature flags, experiments, surveys, LLM analytics, data warehouse, CDP, and an AI product assistant to help debug your code, ship features faster, and keep all your usage and customer data in one stack.