Formulas

Last updated:

|Edit this page

Formulas are custom mathematical expressions that you can use to compare and combine the value of multiple series.

Formula map chart

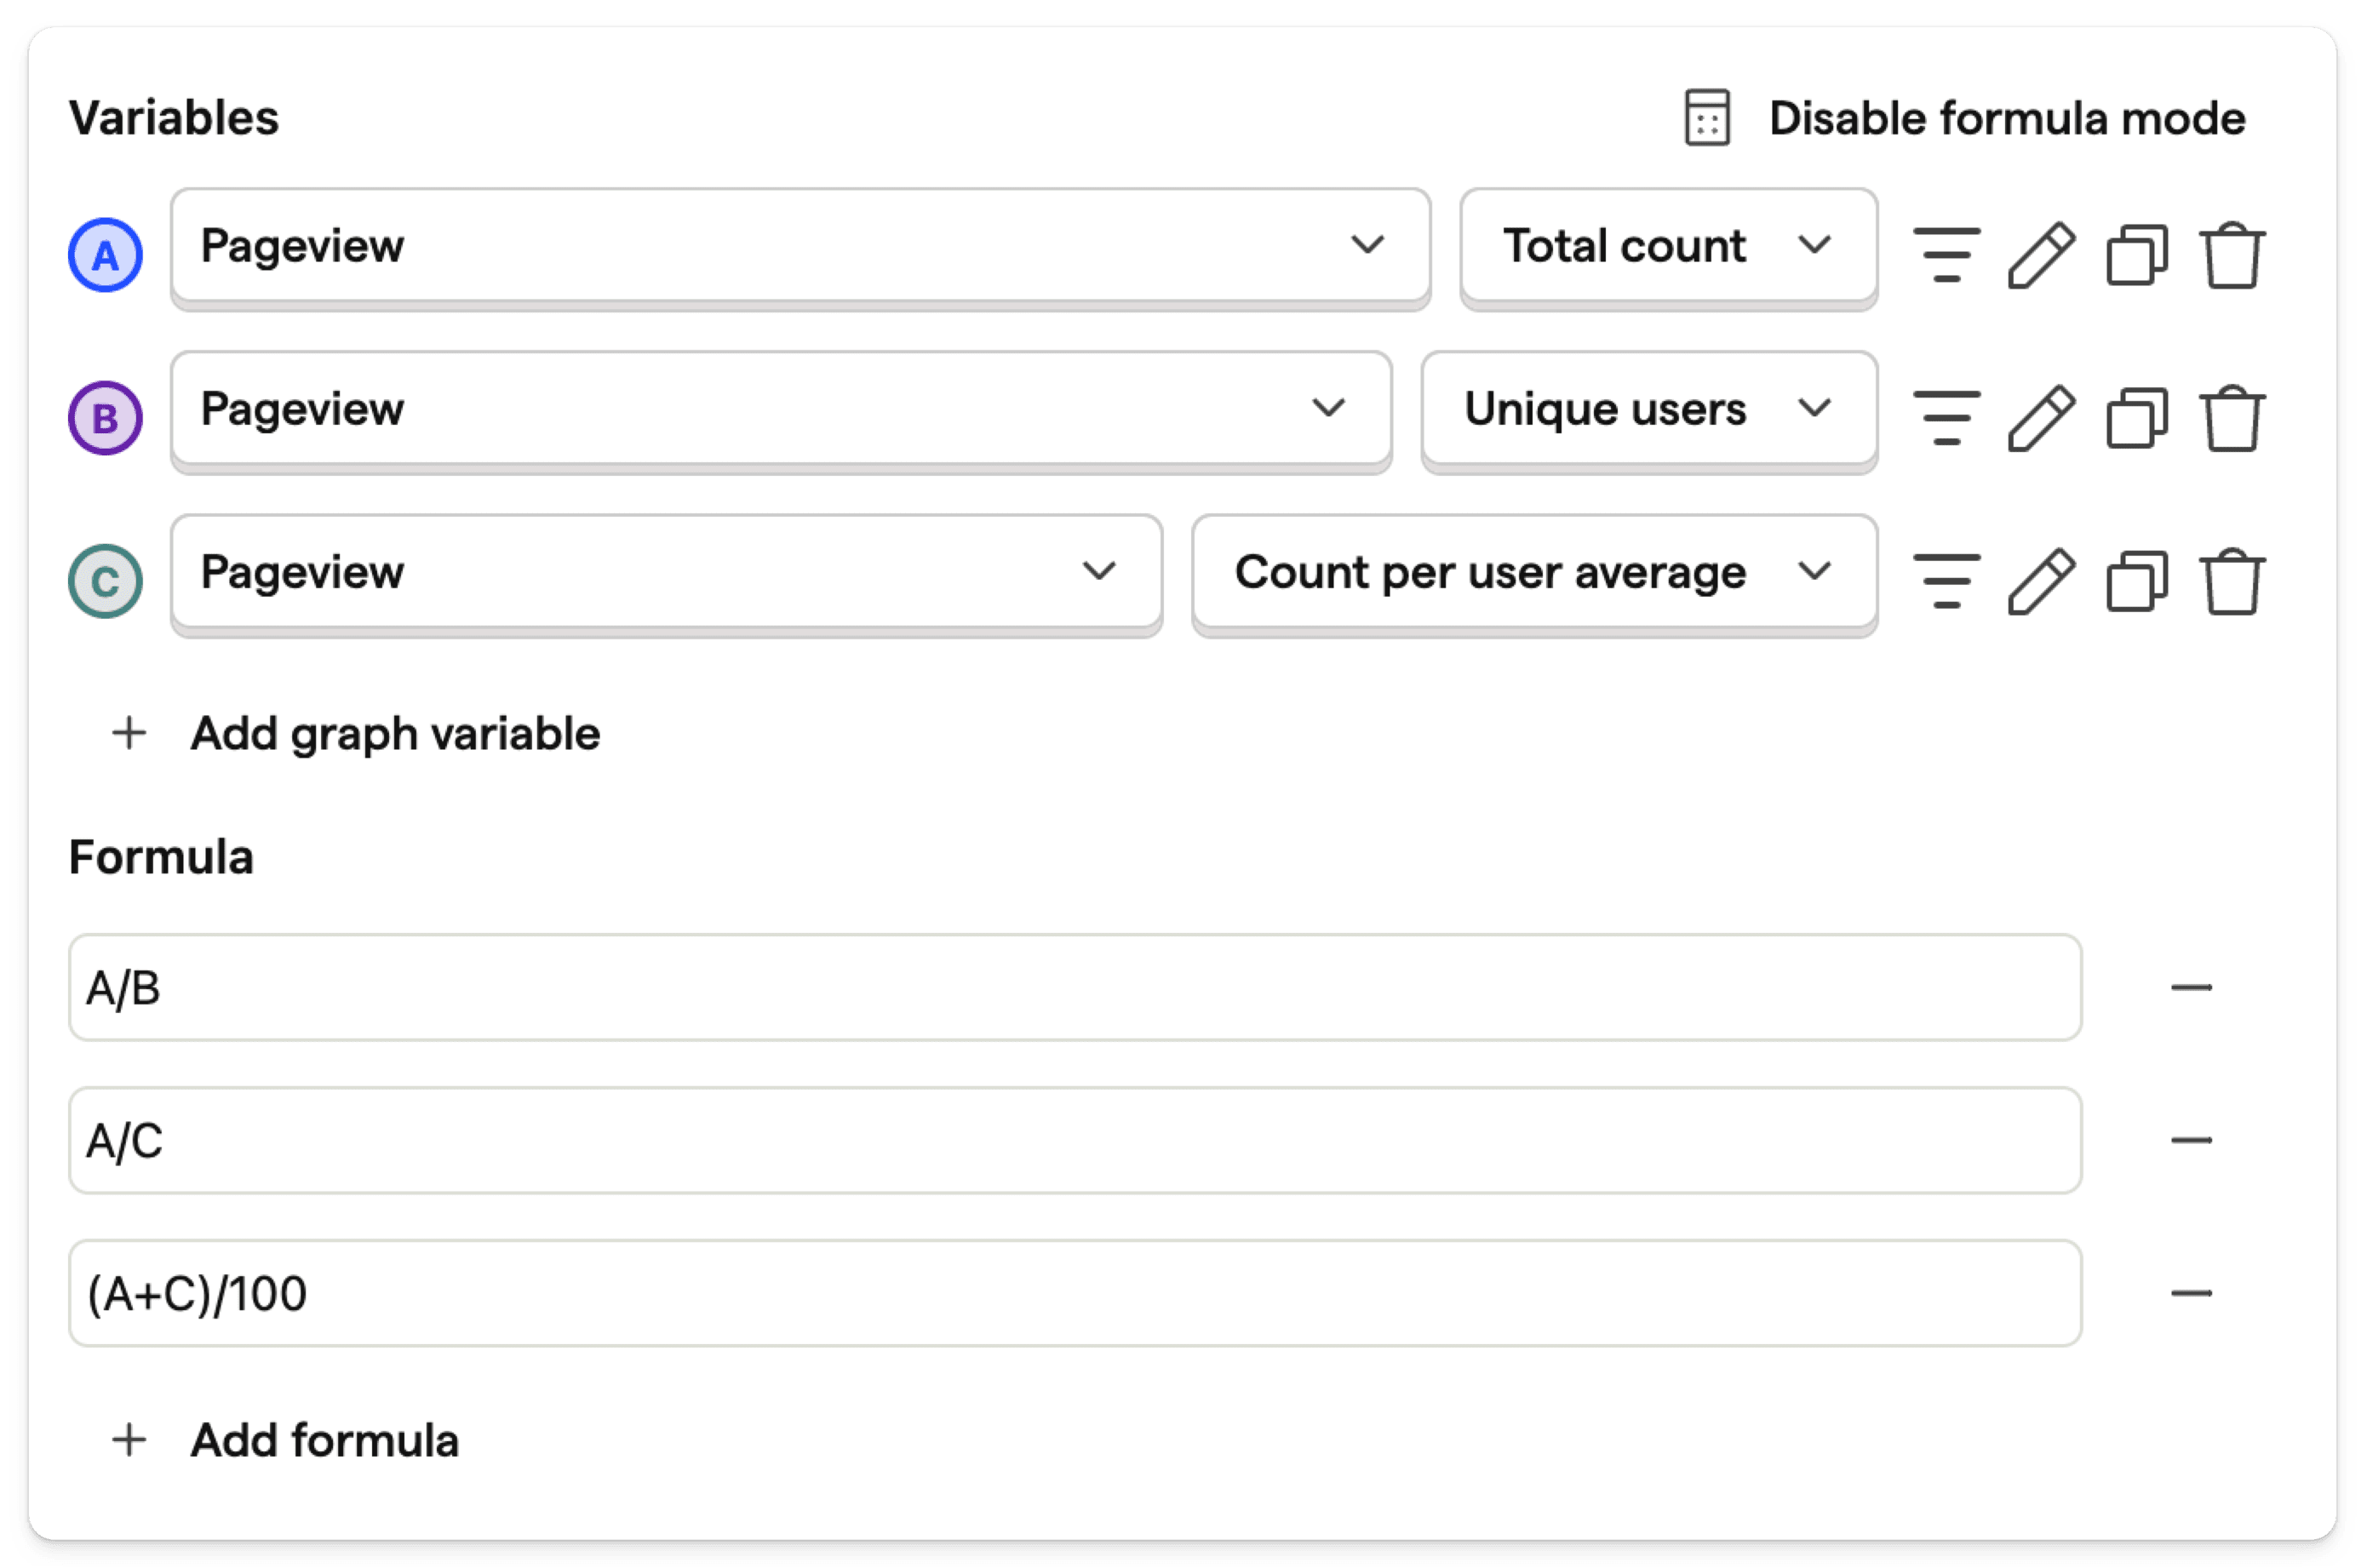
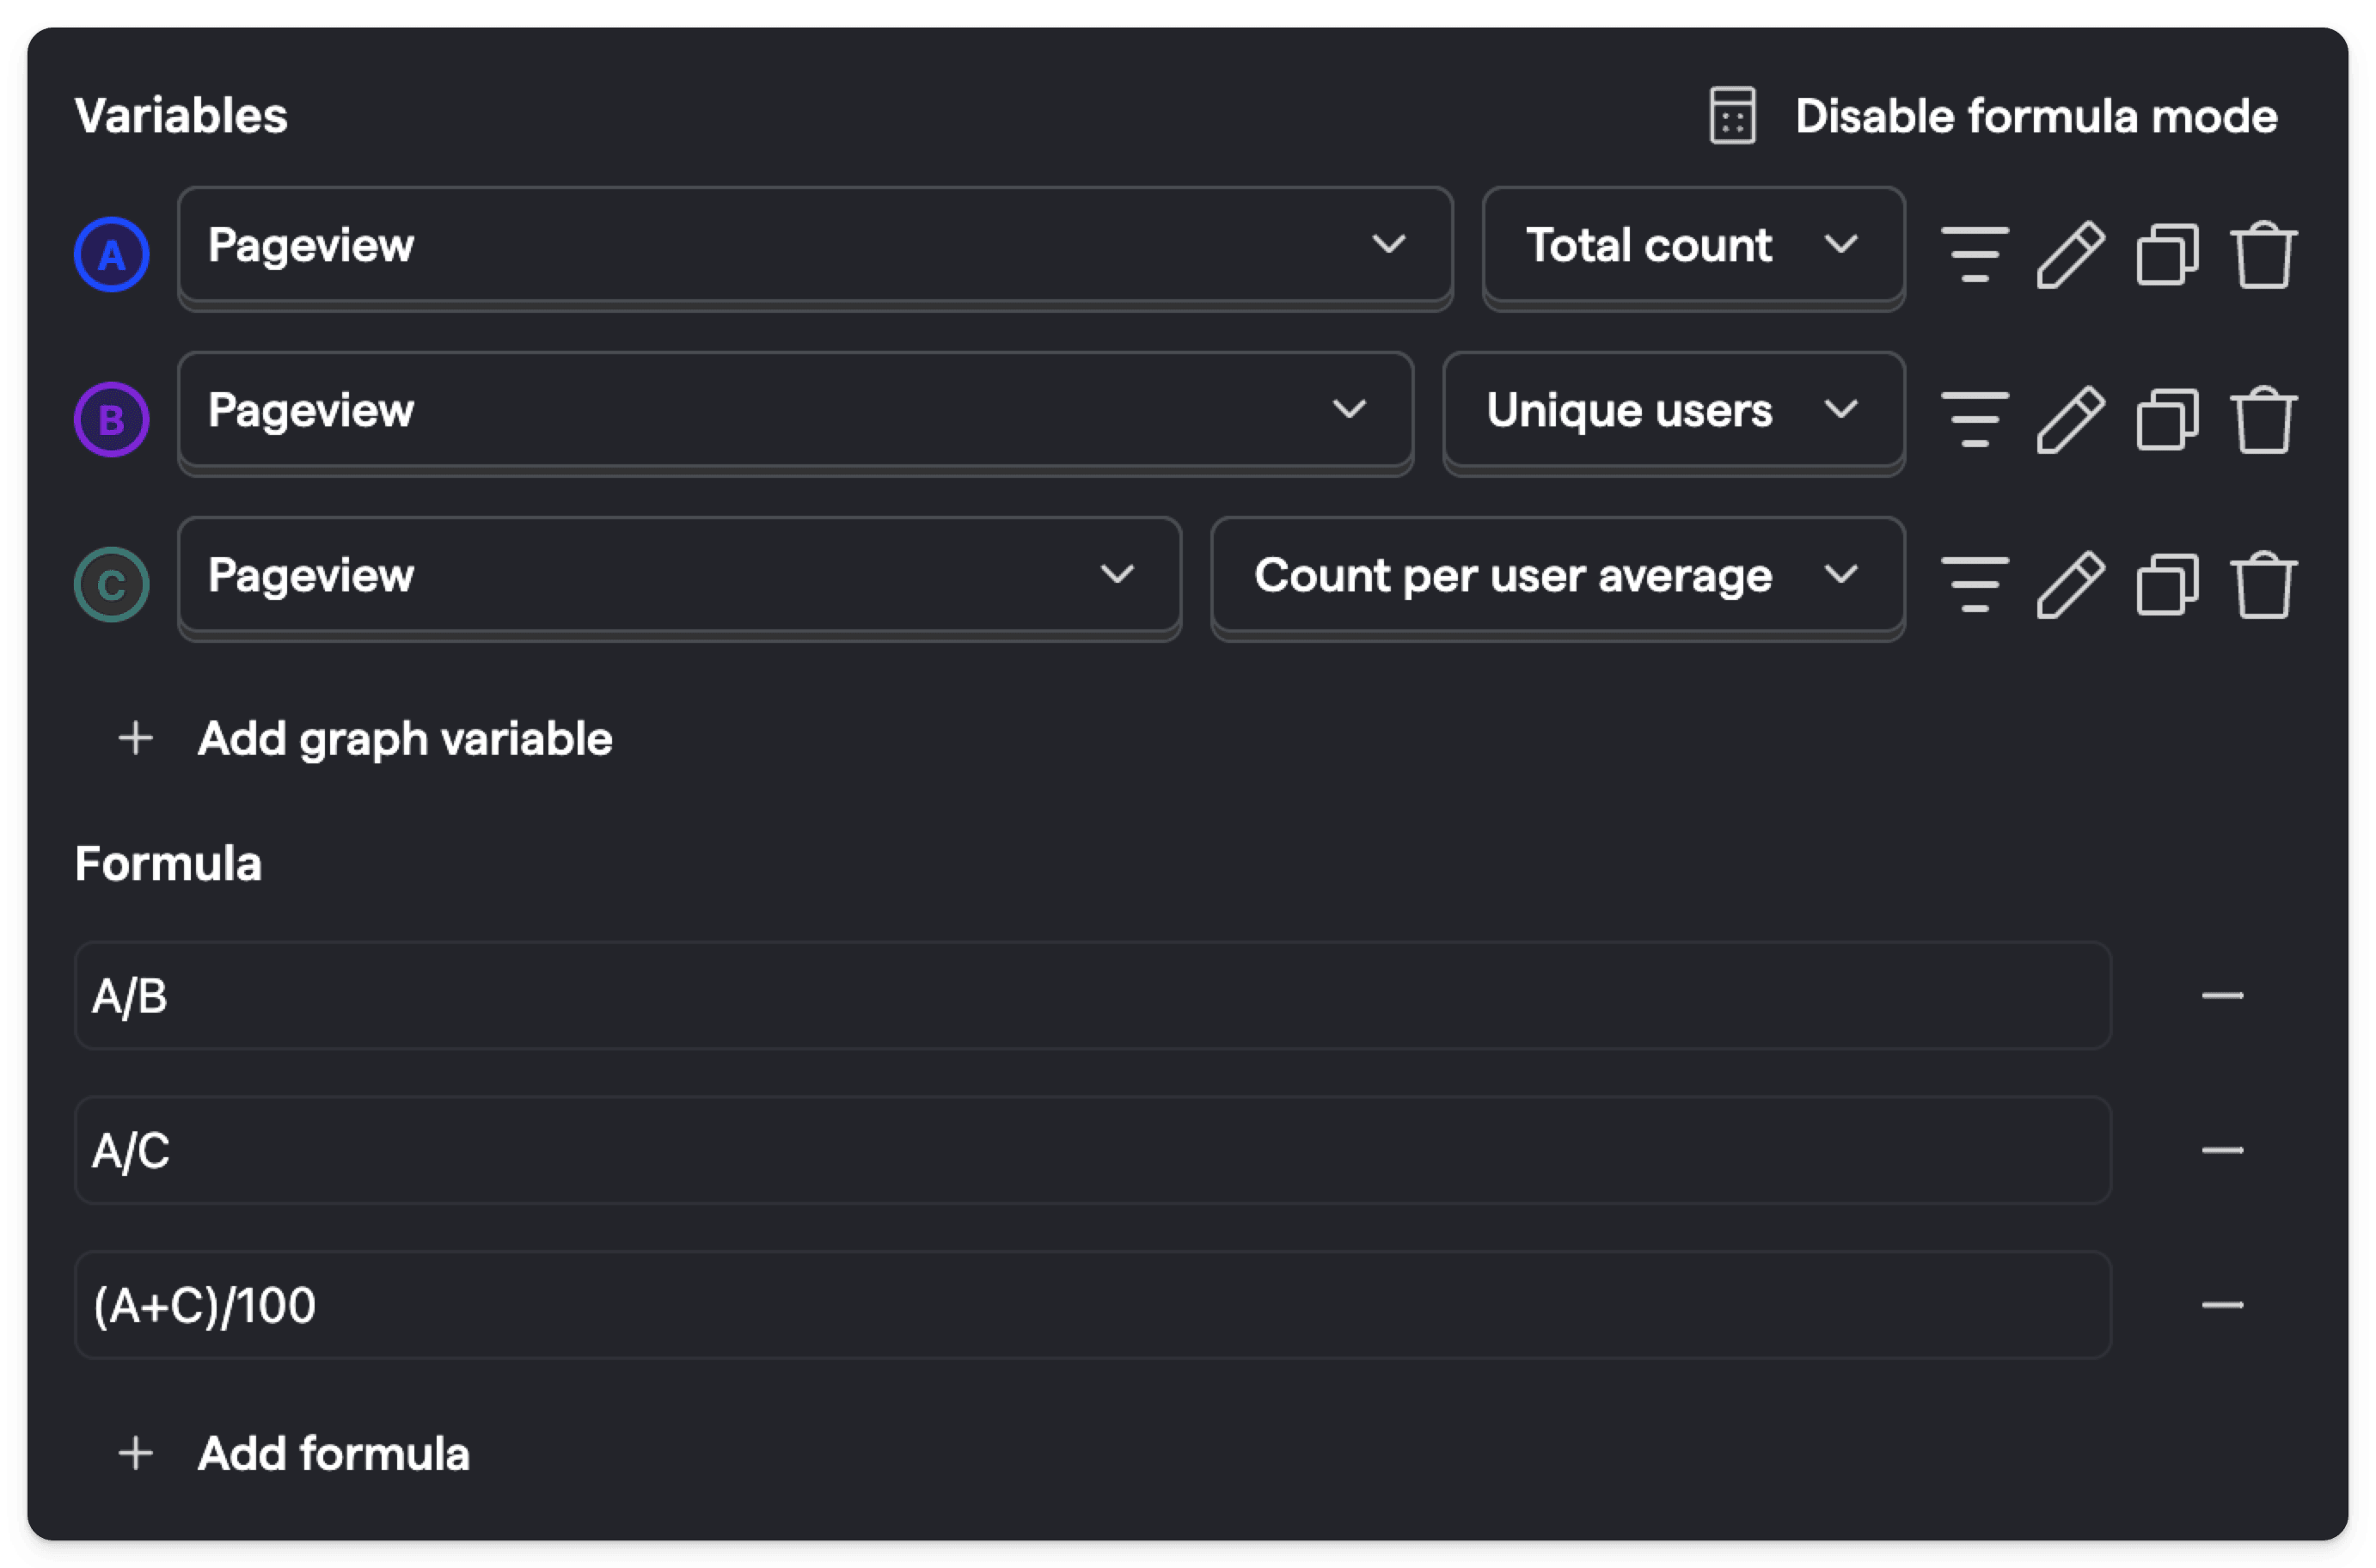
To add a formula, click Enable formula mode. Then, within the input box, type out the expression you would like to evaluate.

This expression can contain any number of basic mathematical operators (+, -, *, /) along with variables (A, B, C, ...), which correspond to the series with that letter.

If you have two series A and B, then the formula A / B will plot the value of series A divided by the value of series B at each point in time.

You can add multiple formulas to your insight, each will be shown as a separate series.

Questions? Ask Max AI.

It's easier than reading through 605 docs articles.

Community questions

Was this page useful?

Next article

Tips

Using the persons modal Clicking on a data point in a trends insight opens the persons modal, which shows you a list of users/groups that performed it during the selected time period. From this menu, you can: Watch specific session replays where the user performed the selected event Dive deep into the properties of each individual user Save the entire list of users as a cohort Export the list of users to a CSV for further analysis Creating insights in notebooks You can create all of PostHog's…

Read next article